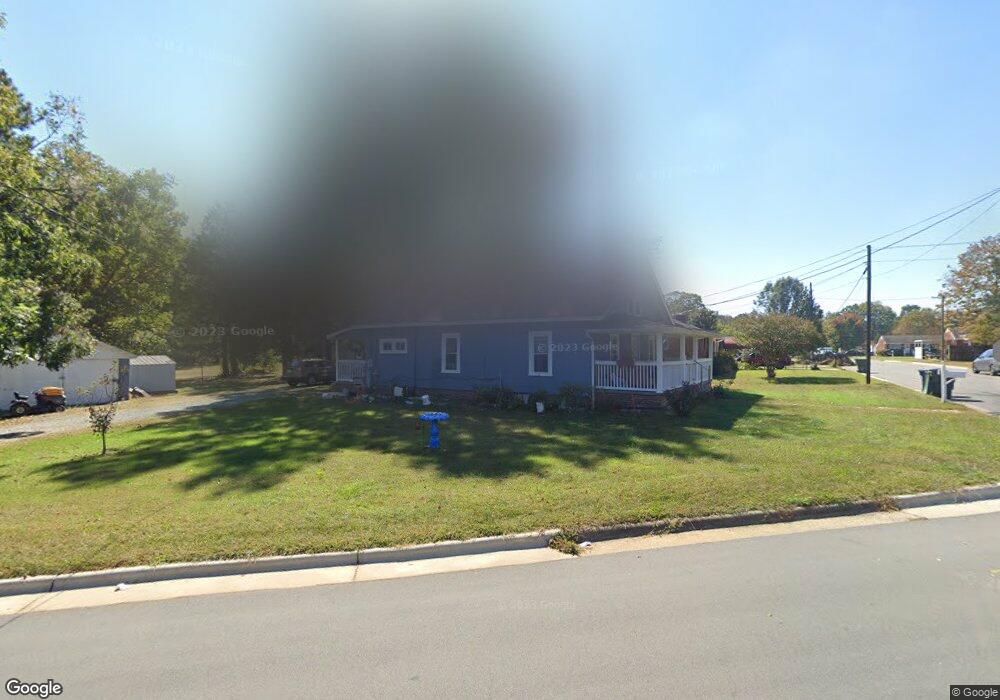
130 Webster Rd Graham, NC 27253
Estimated Value: $257,000 - $288,000
3
Beds
1
Bath
1,397
Sq Ft
$200/Sq Ft
Est. Value
About This Home
This home is located at 130 Webster Rd, Graham, NC 27253 and is currently estimated at $278,702, approximately $199 per square foot. 130 Webster Rd is a home located in Alamance County with nearby schools including South Graham Elementary School, Southern Alamance Middle School, and Southern Alamance High School.
Ownership History
Date
Name
Owned For
Owner Type
Purchase Details
Closed on
Jun 24, 2024
Sold by
Gomez Guillermina Orozco and Martias Luis Alberto
Bought by
Lugui Main Street Llc
Current Estimated Value
Home Financials for this Owner
Home Financials are based on the most recent Mortgage that was taken out on this home.
Original Mortgage
$183,442
Outstanding Balance
$181,132
Interest Rate
7.09%
Mortgage Type
New Conventional
Estimated Equity
$97,570
Purchase Details
Closed on
Oct 2, 2019
Sold by
Huffman Properties Llc
Bought by
Orozco Guillermina Gomez and Martias Luis Alberto Agustin
Home Financials for this Owner
Home Financials are based on the most recent Mortgage that was taken out on this home.
Original Mortgage
$55,000
Interest Rate
3.5%
Purchase Details
Closed on
Jan 1, 1990
Bought by
Huffman Carolyn Thompson
Create a Home Valuation Report for This Property
The Home Valuation Report is an in-depth analysis detailing your home's value as well as a comparison with similar homes in the area
Home Values in the Area
Average Home Value in this Area
Purchase History
| Date | Buyer | Sale Price | Title Company |
|---|---|---|---|
| Lugui Main Street Llc | -- | None Listed On Document | |
| Lugui Main Street Llc | -- | None Listed On Document | |
| Orozco Guillermina Gomez | $85,000 | Attorney | |
| Huffman Carolyn Thompson | -- | -- |
Source: Public Records
Mortgage History
| Date | Status | Borrower | Loan Amount |
|---|---|---|---|
| Open | Lugui Main Street Llc | $183,442 | |
| Closed | Lugui Main Street Llc | $183,442 | |
| Previous Owner | Orozco Guillermina Gomez | $55,000 |
Source: Public Records
Tax History Compared to Growth
Tax History
| Year | Tax Paid | Tax Assessment Tax Assessment Total Assessment is a certain percentage of the fair market value that is determined by local assessors to be the total taxable value of land and additions on the property. | Land | Improvement |
|---|---|---|---|---|
| 2025 | $1,265 | $256,164 | $62,502 | $193,662 |
| 2024 | $1,201 | $256,164 | $62,502 | $193,662 |
| 2023 | $1,107 | $256,164 | $62,502 | $193,662 |
| 2022 | $1,013 | $91,976 | $31,695 | $60,281 |
| 2021 | $1,022 | $91,976 | $31,695 | $60,281 |
| 2020 | $1,032 | $91,976 | $31,695 | $60,281 |
| 2019 | $1,035 | $91,976 | $31,695 | $60,281 |
| 2018 | $0 | $91,976 | $31,695 | $60,281 |
| 2017 | $531 | $91,976 | $31,695 | $60,281 |
| 2016 | $927 | $89,579 | $26,826 | $62,753 |
| 2015 | $517 | $89,579 | $26,826 | $62,753 |
| 2014 | -- | $89,579 | $26,826 | $62,753 |
Source: Public Records
Map
Nearby Homes
- 139 Webster Rd
- 00 Wilton Dr
- 308 Aloha Dr
- 109 Florence St
- 1115 Lorraine St
- 2048 Chandler Village Dr
- 2094 Chandler Village Dr
- 2022 Chandler Village Dr
- 101 Haley Ct
- 627 Carraway Dr
- Lot 54 Forest Dr
- 207 Forest Dr
- 516 Ivey Rd
- 306 Eastway Ln
- 605 Sania Ct
- 218 Braeburn Dr
- 1619 Broadway Dr
- 1707 Wedgewood Dr
- 00 Thompson Rd
- 312 Loon Ct