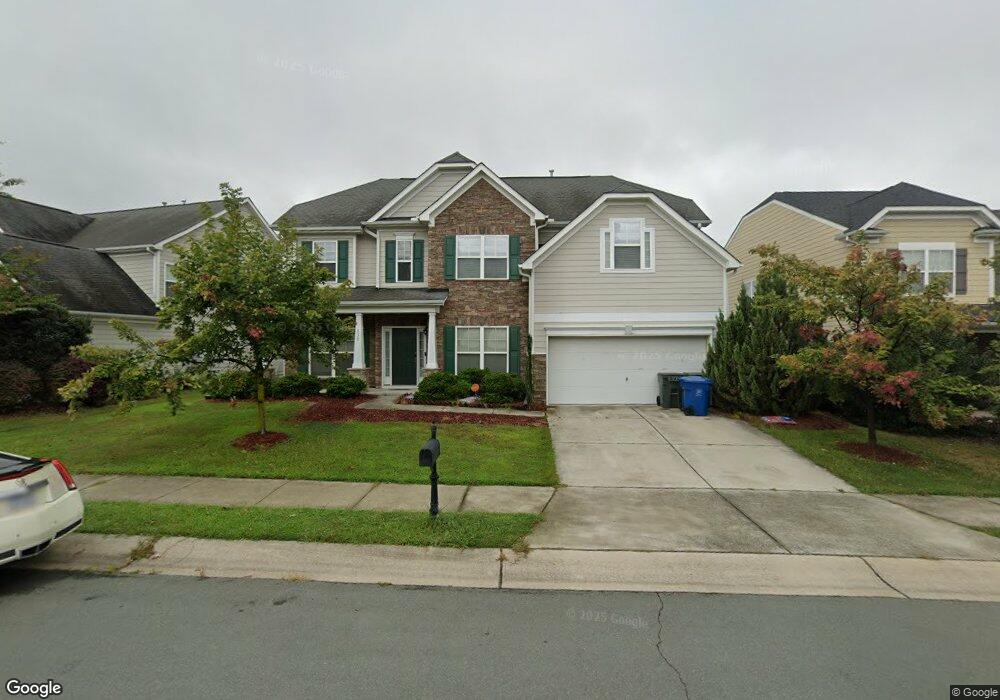
130 Windrush Ln Durham, NC 27703
Eastern Durham NeighborhoodEstimated Value: $448,155 - $558,000
4
Beds
3
Baths
2,640
Sq Ft
$184/Sq Ft
Est. Value
About This Home
This home is located at 130 Windrush Ln, Durham, NC 27703 and is currently estimated at $486,539, approximately $184 per square foot. 130 Windrush Ln is a home located in Durham County with nearby schools including Spring Valley Elementary School, John W Neal Middle School, and Southern School of Energy & Sustainability.
Ownership History
Date
Name
Owned For
Owner Type
Purchase Details
Closed on
May 21, 2024
Sold by
Johnson Oriana Tinique and Leach Oriana Tinique
Bought by
Leach Oriana Tinique and Leach Brandon
Current Estimated Value
Purchase Details
Closed on
Feb 13, 2018
Sold by
Copeland Devetta H and Copeland Enrico
Bought by
Johnson Oriana Tinique and Leach Brandon
Home Financials for this Owner
Home Financials are based on the most recent Mortgage that was taken out on this home.
Original Mortgage
$273,600
Interest Rate
3.95%
Mortgage Type
New Conventional
Purchase Details
Closed on
Jun 30, 2010
Sold by
Hearthstone Multi Asset Entity B L P
Bought by
Nash Devetta H
Home Financials for this Owner
Home Financials are based on the most recent Mortgage that was taken out on this home.
Original Mortgage
$229,904
Interest Rate
3.37%
Mortgage Type
FHA
Create a Home Valuation Report for This Property
The Home Valuation Report is an in-depth analysis detailing your home's value as well as a comparison with similar homes in the area
Home Values in the Area
Average Home Value in this Area
Purchase History
| Date | Buyer | Sale Price | Title Company |
|---|---|---|---|
| Leach Oriana Tinique | -- | None Listed On Document | |
| Leach Oriana Tinique | -- | None Listed On Document | |
| Johnson Oriana Tinique | $288,000 | None Available | |
| Nash Devetta H | $233,000 | None Available |
Source: Public Records
Mortgage History
| Date | Status | Borrower | Loan Amount |
|---|---|---|---|
| Previous Owner | Johnson Oriana Tinique | $273,600 | |
| Previous Owner | Nash Devetta H | $229,904 |
Source: Public Records
Tax History
| Year | Tax Paid | Tax Assessment Tax Assessment Total Assessment is a certain percentage of the fair market value that is determined by local assessors to be the total taxable value of land and additions on the property. | Land | Improvement |
|---|---|---|---|---|
| 2025 | $4,465 | $450,382 | $99,450 | $350,932 |
| 2024 | $3,840 | $275,266 | $43,912 | $231,354 |
| 2023 | $3,606 | $275,266 | $43,912 | $231,354 |
| 2022 | $3,523 | $275,266 | $43,912 | $231,354 |
| 2021 | $3,507 | $275,266 | $43,912 | $231,354 |
| 2020 | $3,424 | $275,266 | $43,912 | $231,354 |
| 2019 | $3,424 | $275,266 | $43,912 | $231,354 |
| 2018 | $3,706 | $273,189 | $46,840 | $226,349 |
| 2017 | $3,678 | $273,189 | $46,840 | $226,349 |
| 2016 | $3,554 | $273,189 | $46,840 | $226,349 |
| 2015 | $3,522 | $254,454 | $41,263 | $213,191 |
| 2014 | $3,522 | $254,454 | $41,263 | $213,191 |
Source: Public Records
Map
Nearby Homes
- 124 Daneborg Rd
- 132 Daneborg Rd
- 110 Elmsford St
- 142 Token House Rd
- 500 Kings Lake Way
- 533 Kings Lake Way
- 111 Glenview Ln
- 407 Glenview Ln
- 3311 Delmar Dr
- 1107 High Fox Dr
- 1821 S Mineral Springs Rd
- 210 Hico Way
- 3150 Gypsum Dr
- 3204 Gypsum Dr
- 3208 Gypsum Dr
- 3210 Gypsum Dr
- 3212 Gypsum Dr
- 3214 Gypsum Dr
- 3216 Gypsum Dr
- 3218 Gypsum Dr
- 128 Windrush Ln
- 134 Windrush Ln
- 245 Ashton Glen
- 126 Windrush Ln
- 243 Ashton Glen
- 247 Ashton Glen
- 136 Windrush Ln
- 241 Ashton Glen
- 129 Windrush Ln
- 133 Windrush Ln
- 131 Windrush Ln
- 127 Windrush Ln
- 124 Windrush Ln
- 239 Ashton Glen
- 135 Windrush Ln
- 140 Windrush Ln
- 122 Windrush Ln
- 137 Windrush Ln
- 119 Windrush Ln
- 123 Windrush Ln
Your Personal Tour Guide
Ask me questions while you tour the home.