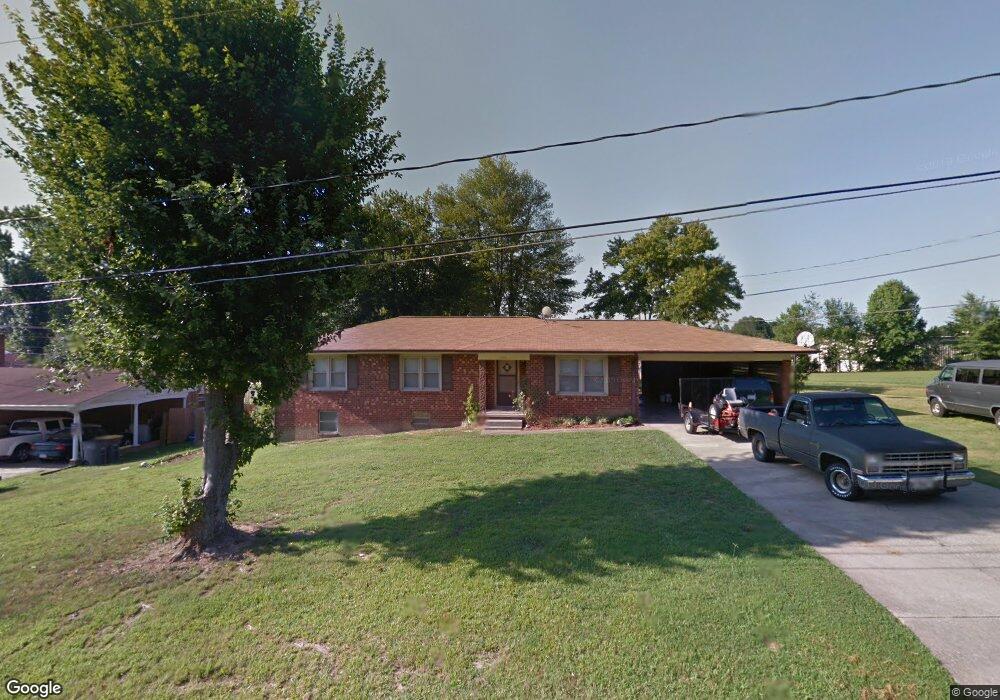
1300 Debbie St Kannapolis, NC 28083
Estimated Value: $313,000 - $353,000
3
Beds
2
Baths
1,478
Sq Ft
$224/Sq Ft
Est. Value
About This Home
This home is located at 1300 Debbie St, Kannapolis, NC 28083 and is currently estimated at $331,209, approximately $224 per square foot. 1300 Debbie St is a home located in Cabarrus County with nearby schools including Jackson Park Elementary School, Kannapolis Middle, and A.L. Brown High School.
Ownership History
Date
Name
Owned For
Owner Type
Purchase Details
Closed on
Mar 3, 2022
Sold by
Kutzer Mary K
Bought by
Kutzer Mary K and Kutzer Cody Louis
Current Estimated Value
Home Financials for this Owner
Home Financials are based on the most recent Mortgage that was taken out on this home.
Original Mortgage
$275,500
Outstanding Balance
$260,341
Interest Rate
5%
Mortgage Type
New Conventional
Estimated Equity
$70,868
Purchase Details
Closed on
Mar 2, 2022
Sold by
Ortiz Benny and Ortiz Candida
Bought by
Kutzer Mary K
Home Financials for this Owner
Home Financials are based on the most recent Mortgage that was taken out on this home.
Original Mortgage
$275,500
Outstanding Balance
$260,341
Interest Rate
5%
Mortgage Type
New Conventional
Estimated Equity
$70,868
Purchase Details
Closed on
Aug 31, 2017
Sold by
Better Choice Properties Llc
Bought by
Ortiz Benny
Home Financials for this Owner
Home Financials are based on the most recent Mortgage that was taken out on this home.
Original Mortgage
$161,405
Interest Rate
3.96%
Mortgage Type
New Conventional
Purchase Details
Closed on
Aug 10, 2007
Sold by
Gibson Curtis F and Gibson Deborrah A
Bought by
Simpson Robert J and Simpson Stephanie A
Create a Home Valuation Report for This Property
The Home Valuation Report is an in-depth analysis detailing your home's value as well as a comparison with similar homes in the area
Home Values in the Area
Average Home Value in this Area
Purchase History
| Date | Buyer | Sale Price | Title Company |
|---|---|---|---|
| Kutzer Mary K | -- | Tryon Title | |
| Kutzer Mary K | $295,000 | Tryon Title | |
| Ortiz Benny | $169,900 | None Available | |
| Simpson Robert J | -- | None Available |
Source: Public Records
Mortgage History
| Date | Status | Borrower | Loan Amount |
|---|---|---|---|
| Open | Kutzer Mary K | $275,500 | |
| Closed | Kutzer Mary K | $275,500 | |
| Previous Owner | Ortiz Benny | $161,405 |
Source: Public Records
Tax History Compared to Growth
Tax History
| Year | Tax Paid | Tax Assessment Tax Assessment Total Assessment is a certain percentage of the fair market value that is determined by local assessors to be the total taxable value of land and additions on the property. | Land | Improvement |
|---|---|---|---|---|
| 2025 | $3,318 | $292,200 | $65,000 | $227,200 |
| 2024 | $3,318 | $292,200 | $65,000 | $227,200 |
| 2023 | $2,648 | $193,280 | $100,190 | $93,090 |
| 2022 | $2,350 | $171,500 | $100,190 | $71,310 |
| 2021 | $2,350 | $171,500 | $100,190 | $71,310 |
| 2020 | $2,350 | $171,500 | $100,190 | $71,310 |
| 2019 | $1,728 | $126,120 | $32,920 | $93,200 |
| 2018 | $1,703 | $126,120 | $32,920 | $93,200 |
| 2017 | $1,677 | $126,120 | $32,920 | $93,200 |
| 2016 | $1,677 | $128,970 | $32,920 | $96,050 |
| 2015 | $1,625 | $128,970 | $32,920 | $96,050 |
| 2014 | $1,625 | $128,970 | $32,920 | $96,050 |
Source: Public Records
Map
Nearby Homes
- 406 Ruth Ave
- 311 Jean Ave
- 1406 Shepard St
- 1526 Shepard St
- 302 Melinda Ave
- 314 N Little Texas Rd
- 1102 Lane St
- 137 Beaumont Ave
- 141 Beaumont Ave
- 604 Pearl Ave
- 1517 Jamaica Rd
- 132 Kennedy Ave
- 904 Venus St
- 2040 Brantley Creek Dr
- 2010 Samantha Dr
- 712 Grace Ave
- 1218 Martin Luther King Junior Ave
- 818 Skyland St
- 1202 Woodlawn St
- 807 Carolyn Ave