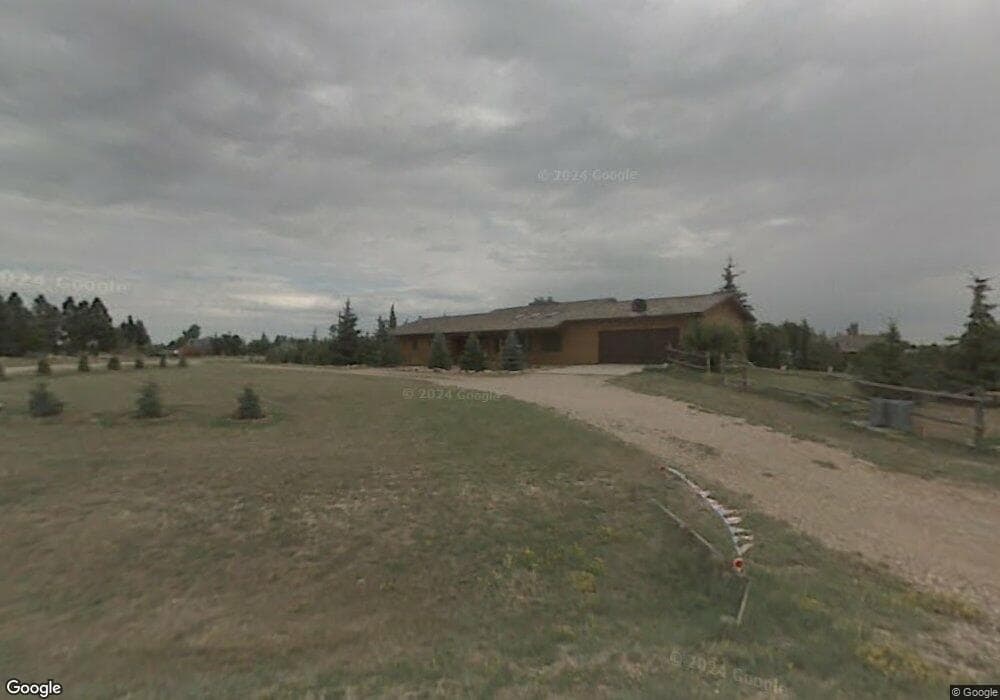
1300 Hackamore Rd Cheyenne, WY 82009
Ranchettes NeighborhoodEstimated Value: $604,542 - $778,000
--
Bed
--
Bath
2,179
Sq Ft
$317/Sq Ft
Est. Value
About This Home
This home is located at 1300 Hackamore Rd, Cheyenne, WY 82009 and is currently estimated at $690,636, approximately $316 per square foot. 1300 Hackamore Rd is a home located in Laramie County with nearby schools including Prairie Wind Elementary School, McCormick Junior High School, and Central High School.
Ownership History
Date
Name
Owned For
Owner Type
Purchase Details
Closed on
May 15, 2024
Sold by
Frank Mark A and Frank Michelle R
Bought by
Mark And Michelle Frank Living Trust and Frank
Current Estimated Value
Home Financials for this Owner
Home Financials are based on the most recent Mortgage that was taken out on this home.
Original Mortgage
$150,000
Outstanding Balance
$147,720
Interest Rate
6.79%
Mortgage Type
Credit Line Revolving
Estimated Equity
$542,916
Purchase Details
Closed on
Apr 23, 2024
Sold by
Mark And Michelle Frank Living Trust and Frank Mark A
Bought by
Frank Mark A and Frank Michelle R
Home Financials for this Owner
Home Financials are based on the most recent Mortgage that was taken out on this home.
Original Mortgage
$150,000
Outstanding Balance
$147,720
Interest Rate
6.79%
Mortgage Type
Credit Line Revolving
Estimated Equity
$542,916
Purchase Details
Closed on
Dec 14, 2020
Sold by
Frank Mark A and Frank Michelle R
Bought by
Mark And Michelle Frank Living Trust and Frank
Purchase Details
Closed on
Dec 4, 2020
Sold by
Frank Mark A and Frank Michelle R
Bought by
Frank Mark A and Frank Michelle R
Create a Home Valuation Report for This Property
The Home Valuation Report is an in-depth analysis detailing your home's value as well as a comparison with similar homes in the area
Home Values in the Area
Average Home Value in this Area
Purchase History
| Date | Buyer | Sale Price | Title Company |
|---|---|---|---|
| Mark And Michelle Frank Living Trust | -- | None Listed On Document | |
| Frank Mark A | -- | None Listed On Document | |
| Mark And Michelle Frank Living Trust | -- | None Listed On Document | |
| Frank Mark A | -- | None Available |
Source: Public Records
Mortgage History
| Date | Status | Borrower | Loan Amount |
|---|---|---|---|
| Open | Frank Mark A | $150,000 |
Source: Public Records
Tax History Compared to Growth
Tax History
| Year | Tax Paid | Tax Assessment Tax Assessment Total Assessment is a certain percentage of the fair market value that is determined by local assessors to be the total taxable value of land and additions on the property. | Land | Improvement |
|---|---|---|---|---|
| 2025 | $3,579 | $41,013 | $6,060 | $34,953 |
| 2024 | $3,579 | $53,246 | $8,080 | $45,166 |
| 2023 | $3,096 | $51,513 | $8,080 | $43,433 |
| 2022 | $3,096 | $46,088 | $10,665 | $35,423 |
| 2021 | $2,701 | $40,108 | $7,185 | $32,923 |
| 2020 | $2,627 | $39,122 | $7,185 | $31,937 |
| 2019 | $2,754 | $40,981 | $7,185 | $33,796 |
| 2018 | $2,501 | $37,594 | $5,449 | $32,145 |
| 2017 | $2,431 | $36,191 | $5,351 | $30,840 |
| 2016 | $2,373 | $35,314 | $5,254 | $30,060 |
| 2015 | $2,278 | $33,883 | $5,254 | $28,629 |
| 2014 | $2,269 | $33,522 | $5,254 | $28,268 |
Source: Public Records
Map
Nearby Homes
- 714 E Ole Maverick Rd
- 9404 Wayne Rd
- 724 E Powell Rd
- Lot 7 W Ole Maverick Rd
- Lot 6 W Ole Maverick Rd
- 7610 Santa Marie Dr
- 1348 Jessi Dr
- 10041 E Four Mile Rd
- 1314 Marie Ln
- 926 Miracle Pkwy
- 210 Ponderosa Trail
- 7115 Macy Place
- 1121 Alyssa Way
- 1213 Alyssa Way
- 7119 Legacy Pkwy
- 723 New Bedford Dr
- 419 Sierra Dr
- 6923 Willshire Blvd
- 10611 Portugee Phillips Rd
- 508 Malibu Ct
- 1304 Hackamore Rd
- 1301 Hackamore Rd
- 9001 Lariat Loop
- 8904 Lariat Loop
- 1305 Hackamore Rd
- 1407 Silver Spur Rd
- 1219 Hackamore Rd
- 9002 Lariat Loop
- 8812 Cowpoke Rd
- 8906 Cowpoke Rd
- 1302 Silver Spur Rd
- 1505 Silver Spur Rd
- 8720 Cowpoke Rd
- 8736 Cowpoke Rd
- 1408 Silver Spur Rd
- 8714 Cowpoke Rd
- 1218 Silver Spur Rd
- 9019 Wildflower Dr
- 9100 Cowpoke Rd
- 8907 Cowpoke Rd