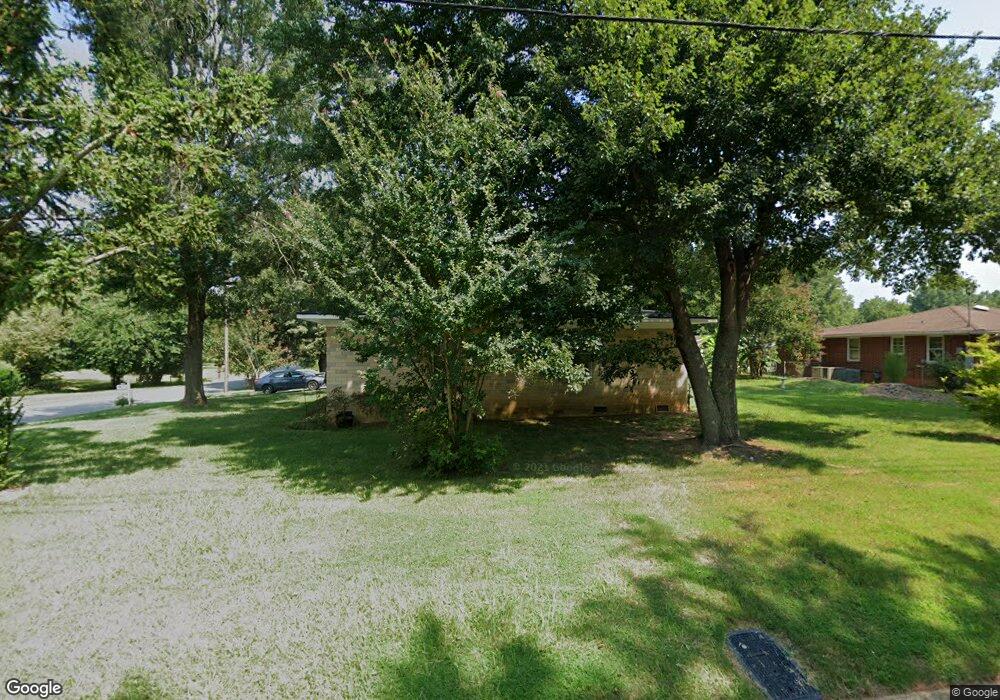
1300 N Shaver St Salisbury, NC 28144
Estimated Value: $235,000 - $298,000
--
Bed
2
Baths
2,075
Sq Ft
$126/Sq Ft
Est. Value
About This Home
This home is located at 1300 N Shaver St, Salisbury, NC 28144 and is currently estimated at $260,992, approximately $125 per square foot. 1300 N Shaver St is a home located in Rowan County with nearby schools including E Hanford Dole Elementary School, North Rowan Middle School, and North Rowan High School.
Ownership History
Date
Name
Owned For
Owner Type
Purchase Details
Closed on
May 23, 2024
Sold by
Curry Sadie Belton and Geter Maggie Belton
Bought by
Robbins Christopher D
Current Estimated Value
Home Financials for this Owner
Home Financials are based on the most recent Mortgage that was taken out on this home.
Original Mortgage
$93,600
Outstanding Balance
$91,743
Interest Rate
5%
Mortgage Type
New Conventional
Estimated Equity
$169,249
Purchase Details
Closed on
Dec 21, 2000
Bought by
Curry Sadie
Create a Home Valuation Report for This Property
The Home Valuation Report is an in-depth analysis detailing your home's value as well as a comparison with similar homes in the area
Home Values in the Area
Average Home Value in this Area
Purchase History
| Date | Buyer | Sale Price | Title Company |
|---|---|---|---|
| Robbins Christopher D | $104,000 | None Listed On Document | |
| Robbins Christopher D | $104,000 | None Listed On Document | |
| Curry Sadie | -- | -- |
Source: Public Records
Mortgage History
| Date | Status | Borrower | Loan Amount |
|---|---|---|---|
| Open | Robbins Christopher D | $93,600 | |
| Closed | Robbins Christopher D | $15,000 | |
| Closed | Robbins Christopher D | $93,600 |
Source: Public Records
Tax History Compared to Growth
Tax History
| Year | Tax Paid | Tax Assessment Tax Assessment Total Assessment is a certain percentage of the fair market value that is determined by local assessors to be the total taxable value of land and additions on the property. | Land | Improvement |
|---|---|---|---|---|
| 2025 | $2,700 | $225,790 | $29,250 | $196,540 |
| 2024 | $2,584 | $216,040 | $19,500 | $196,540 |
| 2023 | $2,584 | $216,040 | $19,500 | $196,540 |
| 2022 | $1,770 | $128,497 | $15,000 | $113,497 |
| 2021 | $1,770 | $128,497 | $15,000 | $113,497 |
| 2020 | $1,770 | $128,497 | $15,000 | $113,497 |
| 2019 | $1,770 | $128,497 | $15,000 | $113,497 |
| 2018 | $1,536 | $113,066 | $15,000 | $98,066 |
| 2017 | $1,528 | $113,066 | $15,000 | $98,066 |
| 2016 | $1,486 | $113,066 | $15,000 | $98,066 |
| 2015 | $1,495 | $113,066 | $15,000 | $98,066 |
| 2014 | $1,547 | $118,406 | $15,000 | $103,406 |
Source: Public Records
Map
Nearby Homes
- 1116 Bryce Ave
- 1270 N Shaver St
- 1280 N Shaver St
- 1120 Crestview Ave
- 1138 Laurel St
- 1214 Short St
- 1016 Scales St
- Lot 1 Grady St
- 113 E Miller St
- 1104 Grady St
- 1102 Grady St
- 223 W 11th St
- 117 E Steele St
- 1008 N Main St
- 115 E Steele St
- 829 Green St
- 1201 N Church St
- 1713 N Clay St
- 1550 N Lee St
- 203 W 11th St
- 1110 N Shaver St
- 1131 Crestview Ave
- 1107 N Shaver St
- 1205 N Long St
- 1129 Crestview Ave
- 1213 N Long St
- 1129 N Long St
- 1231 N Long St
- 1313 N Long St
- 1123 Crestview Ave
- 1127 N Long St
- 1132 Crestview Ave
- 1315 N Long St
- 1110 Bryce Ave
- 1128 Crestview Ave
- 1115 Bryce Ave
- 1230 N Long St
- 1067 N Long St
- 1124 Crestview Ave
- 1116 N Long St