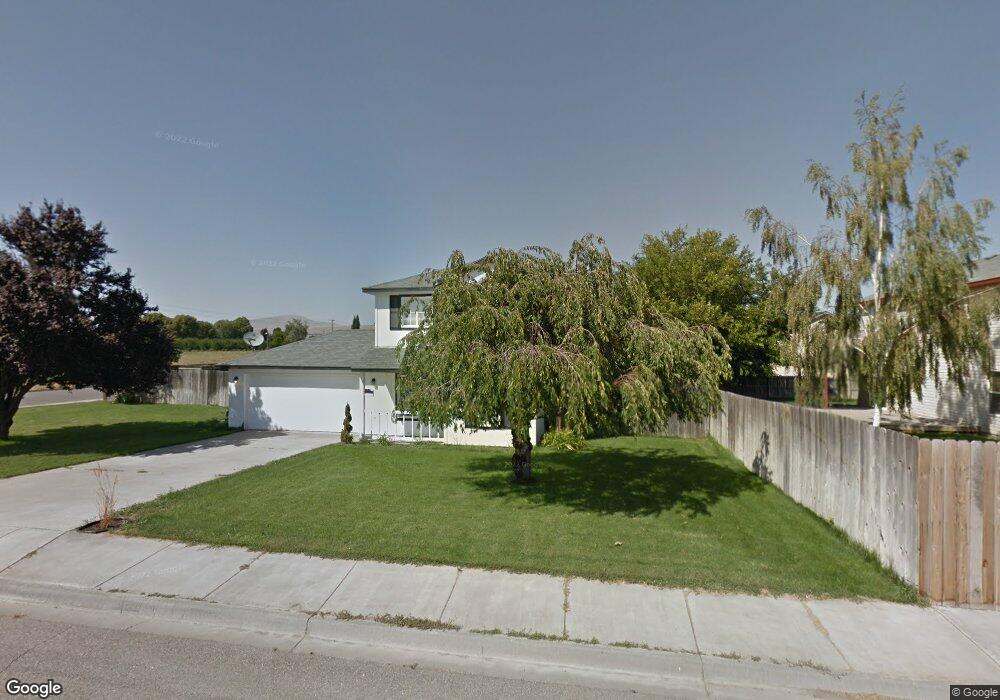
1300 Neptune Unit USDA! Beautiful Upda Benton City, WA 99320
Estimated Value: $354,457 - $408,000
3
Beds
3
Baths
1,520
Sq Ft
$251/Sq Ft
Est. Value
About This Home
This home is located at 1300 Neptune Unit USDA! Beautiful Upda, Benton City, WA 99320 and is currently estimated at $382,114, approximately $251 per square foot. 1300 Neptune Unit USDA! Beautiful Upda is a home located in Benton County with nearby schools including Kiona-Benton City Primary School, Kiona-Benton City Middle School, and Kiona-Benton City High School.
Ownership History
Date
Name
Owned For
Owner Type
Purchase Details
Closed on
Dec 1, 2015
Sold by
Miller Lisa and Miller David R
Bought by
Miller David R
Current Estimated Value
Home Financials for this Owner
Home Financials are based on the most recent Mortgage that was taken out on this home.
Original Mortgage
$159,953
Outstanding Balance
$125,901
Interest Rate
3.73%
Mortgage Type
New Conventional
Estimated Equity
$256,213
Purchase Details
Closed on
Aug 28, 2009
Sold by
Haines Darrell I and Brady Lynn K
Bought by
Brooks Cannon Lauren
Home Financials for this Owner
Home Financials are based on the most recent Mortgage that was taken out on this home.
Original Mortgage
$147,959
Interest Rate
5.09%
Mortgage Type
New Conventional
Create a Home Valuation Report for This Property
The Home Valuation Report is an in-depth analysis detailing your home's value as well as a comparison with similar homes in the area
Home Values in the Area
Average Home Value in this Area
Purchase History
| Date | Buyer | Sale Price | Title Company |
|---|---|---|---|
| Miller David R | -- | Tri City Title & Escrow Llc | |
| Miller David R | $164,900 | Tri City Title & Escrow Llc | |
| Brooks Cannon Lauren | $124,354 | Benton Franklin Title Co |
Source: Public Records
Mortgage History
| Date | Status | Borrower | Loan Amount |
|---|---|---|---|
| Open | Miller David R | $159,953 | |
| Closed | Miller David R | $6,398 | |
| Previous Owner | Brooks Cannon Lauren | $147,959 |
Source: Public Records
Tax History Compared to Growth
Tax History
| Year | Tax Paid | Tax Assessment Tax Assessment Total Assessment is a certain percentage of the fair market value that is determined by local assessors to be the total taxable value of land and additions on the property. | Land | Improvement |
|---|---|---|---|---|
| 2024 | $2,135 | $315,030 | $90,000 | $225,030 |
| 2023 | $2,410 | $256,380 | $50,000 | $206,380 |
| 2022 | $2,330 | $212,930 | $50,000 | $162,930 |
| 2021 | $1,657 | $191,210 | $50,000 | $141,210 |
| 2020 | $2,326 | $174,910 | $50,000 | $124,910 |
| 2019 | $2,140 | $174,910 | $50,000 | $124,910 |
| 2018 | $2,282 | $164,050 | $50,000 | $114,050 |
| 2017 | $1,845 | $140,770 | $22,000 | $118,770 |
| 2016 | $1,965 | $140,770 | $22,000 | $118,770 |
| 2015 | $1,969 | $140,770 | $22,000 | $118,770 |
| 2014 | -- | $140,770 | $22,000 | $118,770 |
| 2013 | -- | $140,770 | $22,000 | $118,770 |
Source: Public Records
Map
Nearby Homes
- 1460 13th St
- 1275 Mary Ave
- 1141 Annajean Ave
- 1291 Lucy Ave
- 1202 Karen Ave
- 1215 17th St
- 1213 12th St
- 1201 17th St
- 1405 Jenna Ave
- 1109 18th St
- 1111 18th St
- 1415 Jenna Ave
- 1413 Jenna Ave
- 1417 Jenna Ave
- Whidbey Plan at Cherry Grove Lane
- Grandview Plan at Cherry Grove Lane
- 6802 E Pendleton Rd
- 0 Lot 3 Block 7 Legion Heights #2 Unit 284583
- 45609 N River Rd
- 2202 Rainy Ln