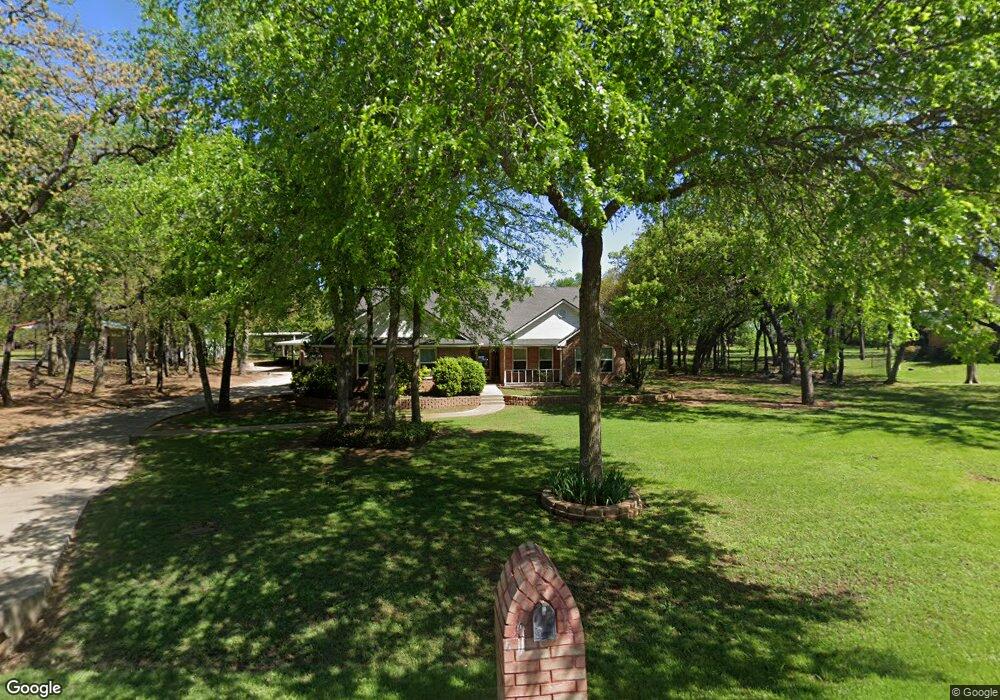
1300 W Buffalo Trail Joshua, TX 76058
Estimated Value: $433,000 - $461,000
3
Beds
2
Baths
2,064
Sq Ft
$217/Sq Ft
Est. Value
About This Home
This home is located at 1300 W Buffalo Trail, Joshua, TX 76058 and is currently estimated at $448,741, approximately $217 per square foot. 1300 W Buffalo Trail is a home located in Johnson County with nearby schools including H.D. Staples Elementary School, R C Loflin Middle School, and Joshua High School - 9th Grade Campus.
Ownership History
Date
Name
Owned For
Owner Type
Purchase Details
Closed on
Jul 7, 2016
Sold by
Brewer Randy A and Brewer Jamie A
Bought by
Bryson Carol F and Bryson Shad
Current Estimated Value
Home Financials for this Owner
Home Financials are based on the most recent Mortgage that was taken out on this home.
Original Mortgage
$254,375
Outstanding Balance
$208,261
Interest Rate
4.4%
Mortgage Type
FHA
Estimated Equity
$240,480
Purchase Details
Closed on
Sep 5, 2008
Sold by
Sedberry Roger G and Sedberry Jennifer L
Bought by
Brewer Randy A and Brewer Jamie A
Home Financials for this Owner
Home Financials are based on the most recent Mortgage that was taken out on this home.
Original Mortgage
$199,192
Interest Rate
6.54%
Mortgage Type
VA
Create a Home Valuation Report for This Property
The Home Valuation Report is an in-depth analysis detailing your home's value as well as a comparison with similar homes in the area
Home Values in the Area
Average Home Value in this Area
Purchase History
| Date | Buyer | Sale Price | Title Company |
|---|---|---|---|
| Bryson Carol F | -- | Alamo Title Co | |
| Brewer Randy A | -- | Providence Title |
Source: Public Records
Mortgage History
| Date | Status | Borrower | Loan Amount |
|---|---|---|---|
| Open | Bryson Carol F | $254,375 | |
| Previous Owner | Brewer Randy A | $199,192 |
Source: Public Records
Tax History Compared to Growth
Tax History
| Year | Tax Paid | Tax Assessment Tax Assessment Total Assessment is a certain percentage of the fair market value that is determined by local assessors to be the total taxable value of land and additions on the property. | Land | Improvement |
|---|---|---|---|---|
| 2025 | $5,582 | $299,503 | $87,210 | $212,293 |
| 2024 | $7,103 | $291,833 | $0 | $0 |
| 2023 | $4,608 | $265,303 | $53,010 | $212,293 |
| 2022 | $6,657 | $265,303 | $53,010 | $212,293 |
| 2021 | $6,778 | $290,994 | $53,010 | $237,984 |
| 2020 | $6,664 | $243,397 | $53,010 | $190,387 |
| 2019 | $8,199 | $285,010 | $36,480 | $248,530 |
| 2018 | $8,251 | $285,010 | $36,480 | $248,530 |
| 2017 | $7,497 | $253,699 | $36,480 | $217,219 |
| 2016 | $6,308 | $213,474 | $36,480 | $176,994 |
| 2015 | $5,533 | $213,474 | $36,480 | $176,994 |
| 2014 | $5,533 | $204,924 | $27,930 | $176,994 |
Source: Public Records
Map
Nearby Homes
- 6490 County Road 1022
- 5529 County Road 1022
- 1700 Don Lee Rd
- 1000 County Road 904
- 2027 Don Lee Rd
- 1945 Chisholm Trail Pkwy
- 5040 Wagon Wheel Rd
- 1728 County Road 904
- 2117 Jordan Ct
- 1509 Saguaro Trail
- 1501 Saguaro Trail
- 1516 Saguaro Trail
- 324 County Road 904
- 1481 Saguaro Trail
- Retreat Plan at Cactus Ridge
- Canyon Plan at Cactus Ridge
- Stockyard Plan at Cactus Ridge
- 4708 Coyote Ct
- 1473 Saguaro Trail
- 1440 Saguaro Trail
- 1216 W Buffalo Trail
- 1208 W Buffalo Trail
- 1223 W Buffalo Trail
- 1301 W Buffalo Trail
- 1316 W Buffalo Trail
- 1215 W Buffalo Trail
- 1309 W Buffalo Trail
- 1207 W Buffalo Trail
- 1200 W Buffalo Trail
- 1321 W Buffalo Trail
- 1320 W Buffalo Trail
- 5728 County Road 1022
- 5632 County Road 1022
- 5601 Wylie Ct
- 1308 County Road 905a
- 1300 County Road 905a
- 5628 County Road 1022
- 1316 County Road 905a
- 5740 County Road 1022
- 1216 County Road 905a