1300 Walton Heath Dr Myrtle Beach, SC 29588
Burgess NeighborhoodEstimated Value: $239,000 - $278,000
3
Beds
2
Baths
1,489
Sq Ft
$180/Sq Ft
Est. Value
About This Home
This home is located at 1300 Walton Heath Dr, Myrtle Beach, SC 29588 and is currently estimated at $267,604, approximately $179 per square foot. 1300 Walton Heath Dr is a home located in Horry County with nearby schools including St. James Elementary School, St. James Middle School, and St. James Intermediate.
Ownership History
Date
Name
Owned For
Owner Type
Purchase Details
Closed on
Dec 30, 2004
Sold by
Rufer Jo A and Ufken Jo A
Bought by
Bria William J
Current Estimated Value
Home Financials for this Owner
Home Financials are based on the most recent Mortgage that was taken out on this home.
Original Mortgage
$99,000
Outstanding Balance
$49,851
Interest Rate
5.71%
Mortgage Type
FHA
Estimated Equity
$217,753
Purchase Details
Closed on
Jul 9, 2002
Sold by
Ufken Michael E
Bought by
Ufken Jo A and Rufer Jo A
Purchase Details
Closed on
May 27, 1998
Sold by
Davis Phillip Michael and Davis Deborah J
Bought by
Ufken Michael E and Ufken Jo A
Home Financials for this Owner
Home Financials are based on the most recent Mortgage that was taken out on this home.
Original Mortgage
$89,763
Interest Rate
7.23%
Mortgage Type
Purchase Money Mortgage
Purchase Details
Closed on
Jul 21, 1994
Sold by
Hayden Donald R
Bought by
Hayden Donald R and Barletta Alice R
Create a Home Valuation Report for This Property
The Home Valuation Report is an in-depth analysis detailing your home's value as well as a comparison with similar homes in the area
Home Values in the Area
Average Home Value in this Area
Purchase History
| Date | Buyer | Sale Price | Title Company |
|---|---|---|---|
| Bria William J | $124,000 | -- | |
| Ufken Jo A | -- | -- | |
| Ufken Michael E | $111,000 | -- | |
| Hayden Donald R | -- | -- | |
| Barletta Alice R | -- | -- |
Source: Public Records
Mortgage History
| Date | Status | Borrower | Loan Amount |
|---|---|---|---|
| Open | Bria William J | $99,000 | |
| Previous Owner | Ufken Michael E | $89,763 |
Source: Public Records
Tax History Compared to Growth
Tax History
| Year | Tax Paid | Tax Assessment Tax Assessment Total Assessment is a certain percentage of the fair market value that is determined by local assessors to be the total taxable value of land and additions on the property. | Land | Improvement |
|---|---|---|---|---|
| 2024 | $801 | $10,104 | $3,200 | $6,904 |
| 2023 | $801 | $6,259 | $1,367 | $4,892 |
| 2021 | $682 | $9,388 | $2,050 | $7,338 |
| 2020 | $589 | $9,388 | $2,050 | $7,338 |
| 2019 | $589 | $9,388 | $2,050 | $7,338 |
| 2018 | $549 | $8,451 | $1,623 | $6,828 |
| 2017 | $534 | $8,451 | $1,623 | $6,828 |
| 2016 | -- | $8,451 | $1,623 | $6,828 |
| 2015 | $534 | $8,451 | $1,623 | $6,828 |
| 2014 | $494 | $8,451 | $1,623 | $6,828 |
Source: Public Records
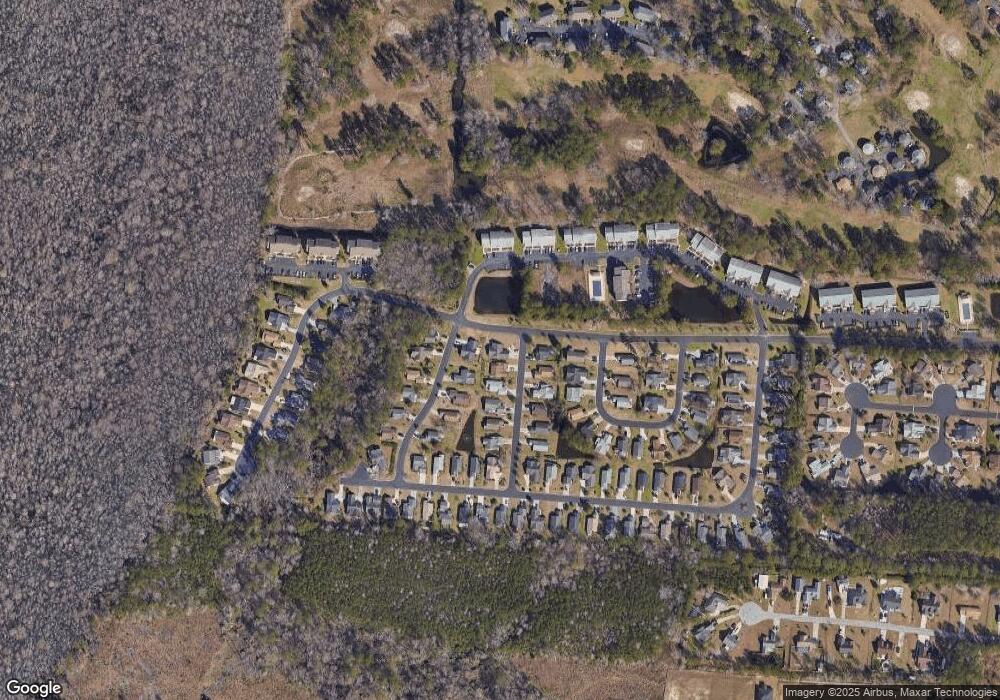
Map
Nearby Homes
- 1260 White Tree Ln Unit F
- 1440 Blue Tree Ct
- 1503 Saint George Ln
- 1450 Blue Tree Ct Unit I
- 1460 Blue Tree Ct Unit E
- 1516 Saint George Ln
- 863 Tall Oaks Ct Unit B-63
- 861 Tall Oaks Ct Unit D-61
- 752 Tall Oaks Ct
- 742 Tall Oaks Ct
- 923 Fairwood Lakes Ln Unit 23-C
- 923 Fairwood Lakes Ln Unit 923G
- 922 Fairwood Lakes Ln Unit 22-D
- 423 Tree Top Ct Unit 23-B
- 711 Gleneagles Dr
- 408 Tree Top Ct Unit 8-B
- HAYDEN Plan at Island Green
- ARDEN Plan at Island Green
- ROBIE Plan at Island Green
- CALI Plan at Island Green
- 1302 Walton Heath Dr
- 1401 Sunningdale Ln
- 1304 Walton Heath Dr
- 1301 Walton Heath Dr
- 1303 Walton Heath Dr
- 1306 Walton Heath Dr
- 1305 Walton Heath Dr
- 1405 Sunningdale Ln
- 1400 Sunningdale Ln
- TBD St George Ln
- 1307 Walton Heath Dr
- 1308 Walton Heath Dr
- TBD St Georges Ln
- 1402 Sunningdale Ln
- 1229 Formby Ct Unit MB
- 1229 Formby Ct
- 1227 Formby Ct
- 1225 Formby Ct
- 1404 Sunningdale Ln
- 1309 Walton Heath Dr