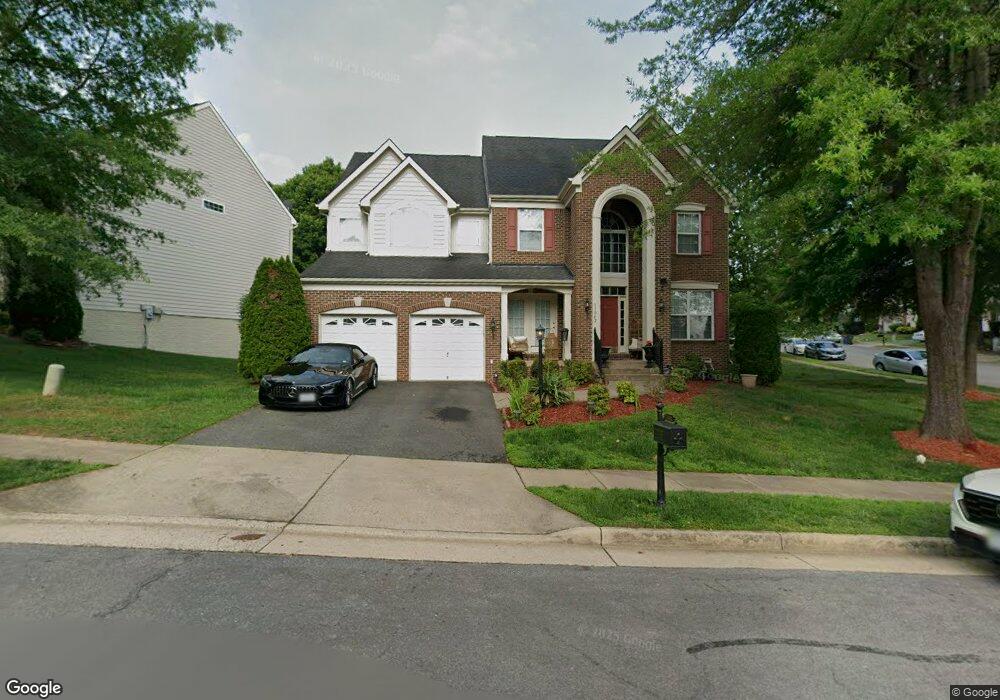
13002 Lashmere Ct Woodbridge, VA 22192
Estimated Value: $755,773 - $902,000
4
Beds
5
Baths
3,382
Sq Ft
$247/Sq Ft
Est. Value
About This Home
This home is located at 13002 Lashmere Ct, Woodbridge, VA 22192 and is currently estimated at $834,943, approximately $246 per square foot. 13002 Lashmere Ct is a home located in Prince William County with nearby schools including Springwoods Elementary School, Charles J. Colgan Senior High School, and Stuart M. Beville Middle School.
Ownership History
Date
Name
Owned For
Owner Type
Purchase Details
Closed on
Apr 16, 2020
Sold by
Flores Gonzalo O
Bought by
Flores Gonzalo O and Alvarado Kevin G
Current Estimated Value
Home Financials for this Owner
Home Financials are based on the most recent Mortgage that was taken out on this home.
Original Mortgage
$431,000
Outstanding Balance
$381,089
Interest Rate
3.3%
Mortgage Type
New Conventional
Estimated Equity
$453,855
Purchase Details
Closed on
May 22, 2018
Sold by
Flores Gonzalo O and Lopez Denia
Bought by
Flores Gonzalo O
Purchase Details
Closed on
Jan 30, 2004
Sold by
Drees Company
Bought by
Flores Gonzalo O and Flores Lopez,Denia
Home Financials for this Owner
Home Financials are based on the most recent Mortgage that was taken out on this home.
Original Mortgage
$409,100
Interest Rate
5.82%
Mortgage Type
New Conventional
Create a Home Valuation Report for This Property
The Home Valuation Report is an in-depth analysis detailing your home's value as well as a comparison with similar homes in the area
Home Values in the Area
Average Home Value in this Area
Purchase History
| Date | Buyer | Sale Price | Title Company |
|---|---|---|---|
| Flores Gonzalo O | -- | Accommodation | |
| Flores Gonzalo O | -- | None Available | |
| Flores Gonzalo O | $511,436 | -- |
Source: Public Records
Mortgage History
| Date | Status | Borrower | Loan Amount |
|---|---|---|---|
| Open | Flores Gonzalo O | $431,000 | |
| Previous Owner | Flores Gonzalo O | $409,100 |
Source: Public Records
Tax History Compared to Growth
Tax History
| Year | Tax Paid | Tax Assessment Tax Assessment Total Assessment is a certain percentage of the fair market value that is determined by local assessors to be the total taxable value of land and additions on the property. | Land | Improvement |
|---|---|---|---|---|
| 2025 | $6,865 | $735,200 | $240,800 | $494,400 |
| 2024 | $6,865 | $690,300 | $227,200 | $463,100 |
| 2023 | $6,814 | $654,900 | $214,300 | $440,600 |
| 2022 | $6,607 | $586,300 | $191,400 | $394,900 |
| 2021 | $6,687 | $549,300 | $178,900 | $370,400 |
| 2020 | $7,866 | $507,500 | $167,800 | $339,700 |
| 2019 | $7,917 | $510,800 | $167,800 | $343,000 |
| 2018 | $5,860 | $485,300 | $156,100 | $329,200 |
| 2017 | $5,990 | $487,300 | $156,100 | $331,200 |
| 2016 | $5,910 | $485,400 | $152,500 | $332,900 |
| 2015 | $5,759 | $494,800 | $152,500 | $342,300 |
| 2014 | $5,759 | $462,700 | $143,100 | $319,600 |
Source: Public Records
Map
Nearby Homes
- 13042 Taverner Loop
- 5019 Anchorstone Dr Unit 5019
- 4800 Wermuth Way
- 5063 Anchorstone Dr Unit 5063
- 5061 Anchorstone Dr Unit 5061
- 13201 Quate Ln
- 12908 Ketterman Dr
- 13101 Kurtz Rd
- 5005 Quiller Ct
- 13002 Kingswell Dr
- 12912 Leatherwood Ln
- 13044 Pilgrims Inn Dr
- 12904 Leatherwood Ln
- 13089 Pilgrims Inn Dr
- 4736 Kirkdale Dr
- 4811 Kirkdale Dr
- 4559 Kendall Dr
- 13025 Pilgrims Inn Dr
- 4903 Chaste Tree Place
- 12910 Kidwell Dr
- 13010 Lashmere Ct
- 4825 Montega Dr
- 13020 Lashmere Ct
- 4829 Montega Dr
- 4820 Montega Dr
- 13001 Lashmere Ct
- 13005 Lashmere Ct
- 4828 Montega Dr
- 4816 Montega Dr
- 13026 Lashmere Ct
- 13031 Quate Ln
- 13009 Lashmere Ct
- 13013 Lashmere Ct
- 4832 Montega Dr
- 4824 Montega Dr
- 13030 Lashmere Ct
- 13035 Quate Ln
- 4815 Montega Dr
- 13017 Lashmere Ct
- 4836 Montega Dr