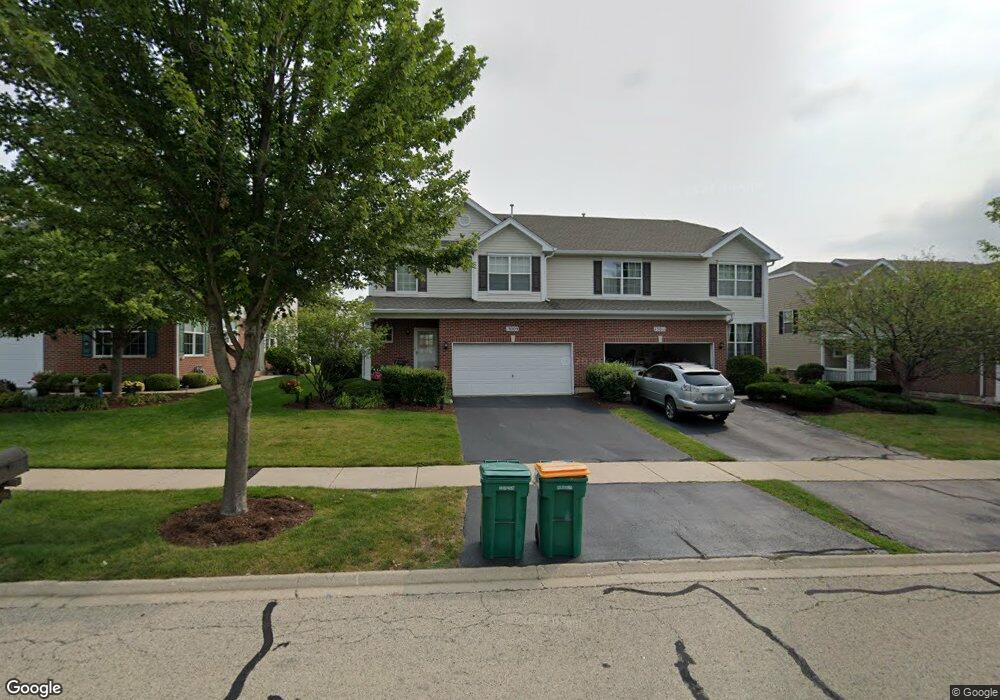
13009 Conifer St Unit 1 Plainfield, IL 60585
Grande Park NeighborhoodEstimated Value: $345,000 - $405,000
3
Beds
3
Baths
2,087
Sq Ft
$179/Sq Ft
Est. Value
About This Home
This home is located at 13009 Conifer St Unit 1, Plainfield, IL 60585 and is currently estimated at $374,471, approximately $179 per square foot. 13009 Conifer St Unit 1 is a home located in Kendall County with nearby schools including Grande Park Elementary School, Murphy Junior High School, and Oswego East High School.
Ownership History
Date
Name
Owned For
Owner Type
Purchase Details
Closed on
Mar 12, 2015
Sold by
Paragon Ventures Llc
Bought by
Remus Scott M
Current Estimated Value
Home Financials for this Owner
Home Financials are based on the most recent Mortgage that was taken out on this home.
Original Mortgage
$175,824
Outstanding Balance
$139,776
Interest Rate
4.75%
Mortgage Type
FHA
Estimated Equity
$234,695
Purchase Details
Closed on
Oct 22, 2014
Sold by
Federal Home Loan Mortgage Corpotion
Bought by
Paragon Ventures Llc
Purchase Details
Closed on
Feb 7, 2014
Sold by
Patrick Sonji V
Bought by
Federal Home Loan Mortgage Corporation
Purchase Details
Closed on
Jun 1, 2007
Sold by
Pasquinelli Tall Pines Llc
Bought by
Patrick Sonji
Home Financials for this Owner
Home Financials are based on the most recent Mortgage that was taken out on this home.
Original Mortgage
$248,400
Interest Rate
6.37%
Mortgage Type
Purchase Money Mortgage
Create a Home Valuation Report for This Property
The Home Valuation Report is an in-depth analysis detailing your home's value as well as a comparison with similar homes in the area
Home Values in the Area
Average Home Value in this Area
Purchase History
We collect this data history from publicly available records. To have your information removed, we recommend requesting removal directly through your county’s website.
| Date | Buyer | Sale Price | Title Company |
|---|---|---|---|
| Remus Scott M | $192,000 | Stewart Title | |
| Paragon Ventures Llc | $132,000 | Stewart Title | |
| Federal Home Loan Mortgage Corporation | -- | None Available | |
| Patrick Sonji | $252,000 | Chicago Title Insurance Co |
Source: Public Records
Mortgage History
We collect this data history from publicly available records. To have your information removed, we recommend requesting removal directly through your county’s website.
| Date | Status | Borrower | Loan Amount |
|---|---|---|---|
| Open | Remus Scott M | $175,824 | |
| Previous Owner | Patrick Sonji | $248,400 |
Source: Public Records
Tax History
| Year | Tax Paid | Tax Assessment Tax Assessment Total Assessment is a certain percentage of the fair market value that is determined by local assessors to be the total taxable value of land and additions on the property. | Land | Improvement |
|---|---|---|---|---|
| 2024 | $8,041 | $102,201 | $23,270 | $78,931 |
| 2023 | $7,127 | $90,443 | $20,593 | $69,850 |
| 2022 | $7,127 | $82,221 | $18,721 | $63,500 |
| 2021 | $6,853 | $76,842 | $17,496 | $59,346 |
| 2020 | $6,918 | $76,842 | $17,496 | $59,346 |
| 2019 | $7,143 | $78,054 | $17,496 | $60,558 |
| 2018 | $7,027 | $75,840 | $17,000 | $58,840 |
| 2017 | $6,854 | $70,879 | $15,888 | $54,991 |
| 2016 | $6,324 | $65,026 | $14,576 | $50,450 |
| 2015 | $5,959 | $59,115 | $13,251 | $45,864 |
| 2014 | -- | $52,612 | $11,793 | $40,819 |
| 2013 | -- | $53,686 | $12,034 | $41,652 |
Source: Public Records
Map
Nearby Homes
- 12807 Timber Wood Cir
- 27016 Thornwood Blvd
- 13005 Timber Wood Cir
- 13008 Timber Wood Cir
- 12937 Grande Poplar Cir
- 13112 Wildwood Place
- 12704 Wild Rye Ct Unit 5B
- 27100 Timber Wood Ct
- 12922 Grande Poplar Cir
- 26615 Silverleaf Dr
- 26613 Silverleaf Dr
- 870 Simons Rd
- 12814 Grande Poplar Cir
- 26602 Grande Poplar Ct
- 12929 Alpine Way
- 13002 Silverleaf Ct
- 26407 Silverleaf Dr
- 26428 Rustling Birch Way
- 12601 S Poplar Crossing
- 13050 S Elizabeth Dr
- 13009 Conifer St
- 13011 Conifer St
- 13007 Conifer St
- 13007 Conifer St Unit 2
- 13015 Conifer St
- 13013 Conifer St
- 12933 Cypress Ln
- 12929 Cypress Ln
- 12927 Cypress Ln
- 12927 Cypress Ln Unit 1
- 12929 Cypress Ln Unit 2
- 13010 Conifer St
- 13008 Conifer St
- 13010 Conifer St Unit 1
- 13025 Conifer St
- 13023 Conifer St
- 13025 Conifer St Unit 13025
- 13025 Conifer St Unit 2
- 13012 Conifer St
- 13014 Conifer St
Your Personal Tour Guide
Ask me questions while you tour the home.