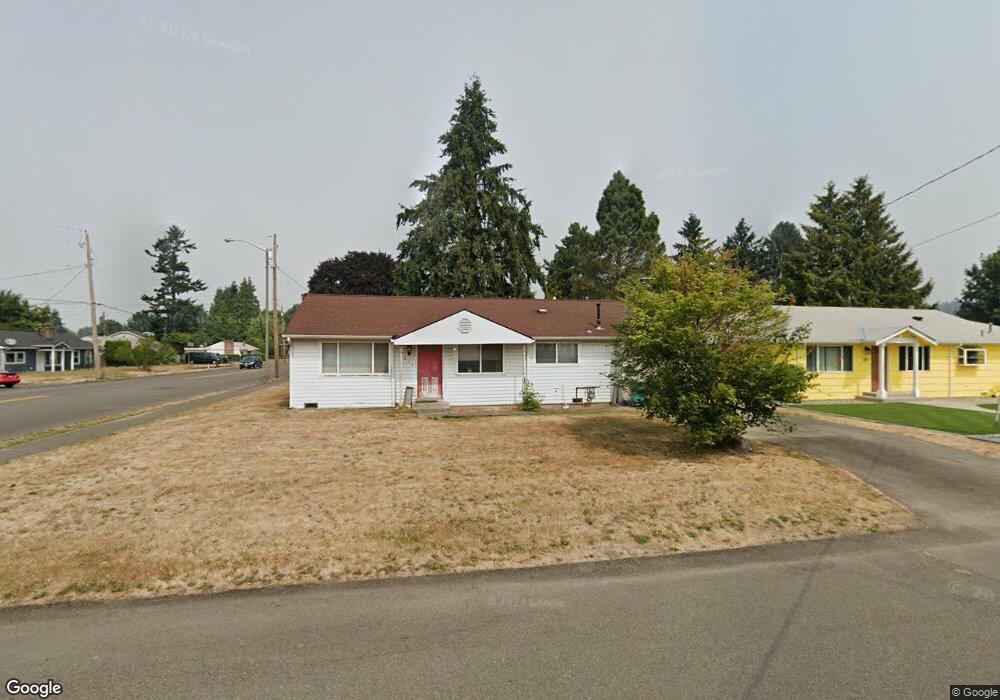
1301 16th St NE Auburn, WA 98002
North Auburn NeighborhoodEstimated Value: $498,113 - $524,000
3
Beds
1
Bath
1,300
Sq Ft
$395/Sq Ft
Est. Value
About This Home
This home is located at 1301 16th St NE, Auburn, WA 98002 and is currently estimated at $513,528, approximately $395 per square foot. 1301 16th St NE is a home located in King County with nearby schools including Dick Scobee Elementary School, Cascade Middle School, and Auburn High School.
Ownership History
Date
Name
Owned For
Owner Type
Purchase Details
Closed on
Jul 31, 2006
Sold by
Rivera Carl V and Rivera Crystal A
Bought by
Rafanelli Donald F
Current Estimated Value
Home Financials for this Owner
Home Financials are based on the most recent Mortgage that was taken out on this home.
Original Mortgage
$26,900
Outstanding Balance
$10,750
Interest Rate
6.76%
Mortgage Type
Stand Alone Second
Estimated Equity
$502,778
Purchase Details
Closed on
May 7, 2003
Sold by
Phillips Doris J
Bought by
Rivera Carl and Rivera Crystal A
Home Financials for this Owner
Home Financials are based on the most recent Mortgage that was taken out on this home.
Original Mortgage
$158,847
Interest Rate
5.84%
Mortgage Type
FHA
Purchase Details
Closed on
Sep 18, 1990
Sold by
Harpold David L and Harpold Carolyn G
Bought by
Phillips Doris J
Create a Home Valuation Report for This Property
The Home Valuation Report is an in-depth analysis detailing your home's value as well as a comparison with similar homes in the area
Home Values in the Area
Average Home Value in this Area
Purchase History
| Date | Buyer | Sale Price | Title Company |
|---|---|---|---|
| Rafanelli Donald F | $269,000 | Ticor National | |
| Rivera Carl | $168,000 | Commonwealth L | |
| Phillips Doris J | $95,000 | -- |
Source: Public Records
Mortgage History
| Date | Status | Borrower | Loan Amount |
|---|---|---|---|
| Open | Rafanelli Donald F | $26,900 | |
| Open | Rafanelli Donald F | $215,200 | |
| Previous Owner | Rivera Carl | $158,847 |
Source: Public Records
Tax History Compared to Growth
Tax History
| Year | Tax Paid | Tax Assessment Tax Assessment Total Assessment is a certain percentage of the fair market value that is determined by local assessors to be the total taxable value of land and additions on the property. | Land | Improvement |
|---|---|---|---|---|
| 2024 | $5,445 | $457,000 | $136,000 | $321,000 |
| 2023 | $4,840 | $402,000 | $109,000 | $293,000 |
| 2022 | $4,475 | $420,000 | $118,000 | $302,000 |
| 2021 | $4,186 | $334,000 | $95,000 | $239,000 |
| 2020 | $3,809 | $295,000 | $89,000 | $206,000 |
| 2018 | $3,976 | $276,000 | $83,000 | $193,000 |
| 2017 | $3,263 | $253,000 | $76,000 | $177,000 |
| 2016 | $2,868 | $206,000 | $73,000 | $133,000 |
| 2015 | $2,834 | $192,000 | $68,000 | $124,000 |
| 2014 | -- | $184,000 | $64,000 | $120,000 |
| 2013 | -- | $141,000 | $59,000 | $82,000 |
Source: Public Records
Map
Nearby Homes
- 1610 M St NE
- 1331 16th St NE
- 1402 22nd St NE Unit 243
- 1402 22nd St NE Unit 27
- 1402 22nd St NE Unit 235
- 1402 22nd St NE Unit 300
- 1402 22nd St NE Unit 269
- 1402 22nd St NE Unit 252
- 1402 22nd St NE Unit 54
- 1402 22nd St NE Unit 29
- 1402 22nd St NE Unit 546
- 1402 22nd St NE Unit 503
- 1402 22nd St NE Unit 406
- 1402 22nd St NE Unit 203
- 1402 22nd St NE Unit 229
- 1402 22nd St NE Unit 549
- 1402 22nd St NE Unit 446
- 1913 M St NE Unit 1913
- 1226 O St NE
- 1104 12th St NE