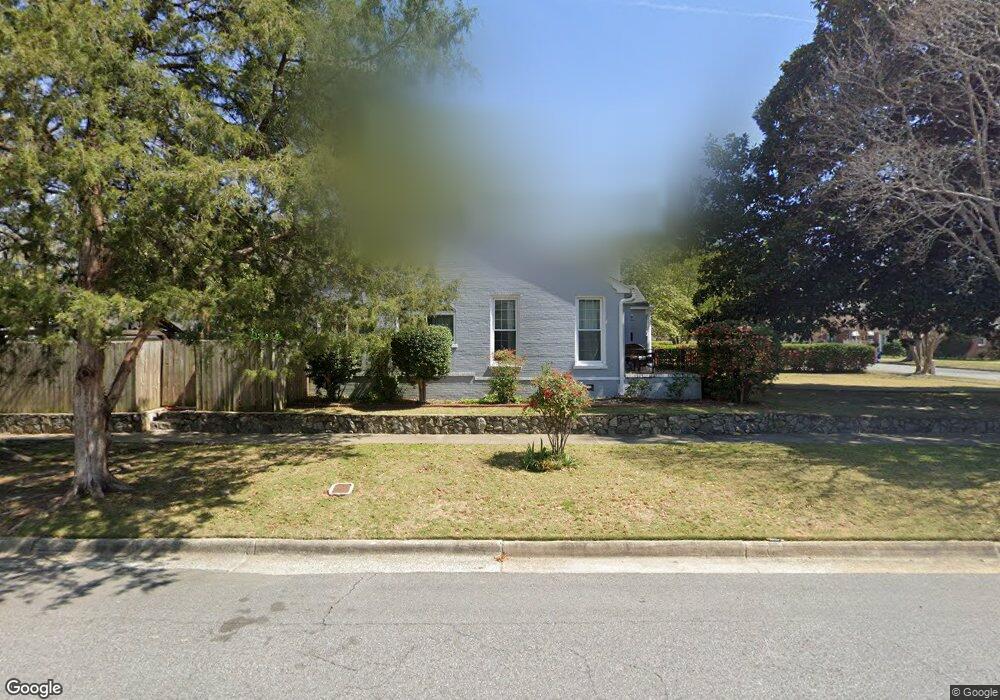
1301 35th St Columbus, GA 31904
North Columbus NeighborhoodEstimated Value: $141,000 - $159,000
3
Beds
3
Baths
1,447
Sq Ft
$104/Sq Ft
Est. Value
About This Home
This home is located at 1301 35th St, Columbus, GA 31904 and is currently estimated at $149,879, approximately $103 per square foot. 1301 35th St is a home located in Muscogee County with nearby schools including Johnson Elementary School, Arnold Middle School, and Jordan Vocational High School.
Ownership History
Date
Name
Owned For
Owner Type
Purchase Details
Closed on
Nov 30, 2007
Sold by
Brown Troy and Brown Ivory
Bought by
Rush David Owen and Rush Elizabeth Sterling
Current Estimated Value
Home Financials for this Owner
Home Financials are based on the most recent Mortgage that was taken out on this home.
Original Mortgage
$115,000
Outstanding Balance
$72,753
Interest Rate
6.29%
Mortgage Type
Purchase Money Mortgage
Estimated Equity
$77,126
Create a Home Valuation Report for This Property
The Home Valuation Report is an in-depth analysis detailing your home's value as well as a comparison with similar homes in the area
Home Values in the Area
Average Home Value in this Area
Purchase History
| Date | Buyer | Sale Price | Title Company |
|---|---|---|---|
| Rush David Owen | $115,000 | None Available |
Source: Public Records
Mortgage History
| Date | Status | Borrower | Loan Amount |
|---|---|---|---|
| Open | Rush David Owen | $115,000 |
Source: Public Records
Tax History Compared to Growth
Tax History
| Year | Tax Paid | Tax Assessment Tax Assessment Total Assessment is a certain percentage of the fair market value that is determined by local assessors to be the total taxable value of land and additions on the property. | Land | Improvement |
|---|---|---|---|---|
| 2025 | $2,173 | $55,500 | $7,932 | $47,568 |
| 2024 | $2,173 | $55,500 | $7,932 | $47,568 |
| 2023 | $2,186 | $55,500 | $7,932 | $47,568 |
| 2022 | $1,672 | $40,960 | $7,932 | $33,028 |
| 2021 | $1,677 | $41,060 | $7,932 | $33,128 |
| 2020 | $1,677 | $41,060 | $7,932 | $33,128 |
| 2019 | $1,682 | $41,060 | $7,932 | $33,128 |
| 2018 | $1,682 | $41,060 | $7,932 | $33,128 |
| 2017 | $1,688 | $41,060 | $7,932 | $33,128 |
| 2016 | $2,351 | $57,002 | $2,852 | $54,150 |
| 2015 | $2,354 | $57,002 | $2,852 | $54,150 |
| 2014 | $2,357 | $57,002 | $2,852 | $54,150 |
| 2013 | -- | $57,002 | $2,852 | $54,150 |
Source: Public Records
Map
Nearby Homes
- 1113 35th St
- 3609 Hamilton Rd
- 1103 32nd St
- 1209 31st St
- 1112 32nd St
- 3430 Woodlawn Ave
- 3030 13th Ave
- 3980 Veterans Pkwy
- 918 Dozier St
- 2917 13th Ave
- 927 Dozier St
- 2901 Peabody Ave
- 2904 Beacon Ave
- 2900 Beacon Ave
- 1703 39th St
- 2901 Beacon Ave
- 3849 Meritas Dr
- 4109 Sherwood Ave
- 3936 7th Ave
- 1810 Shannon Dr