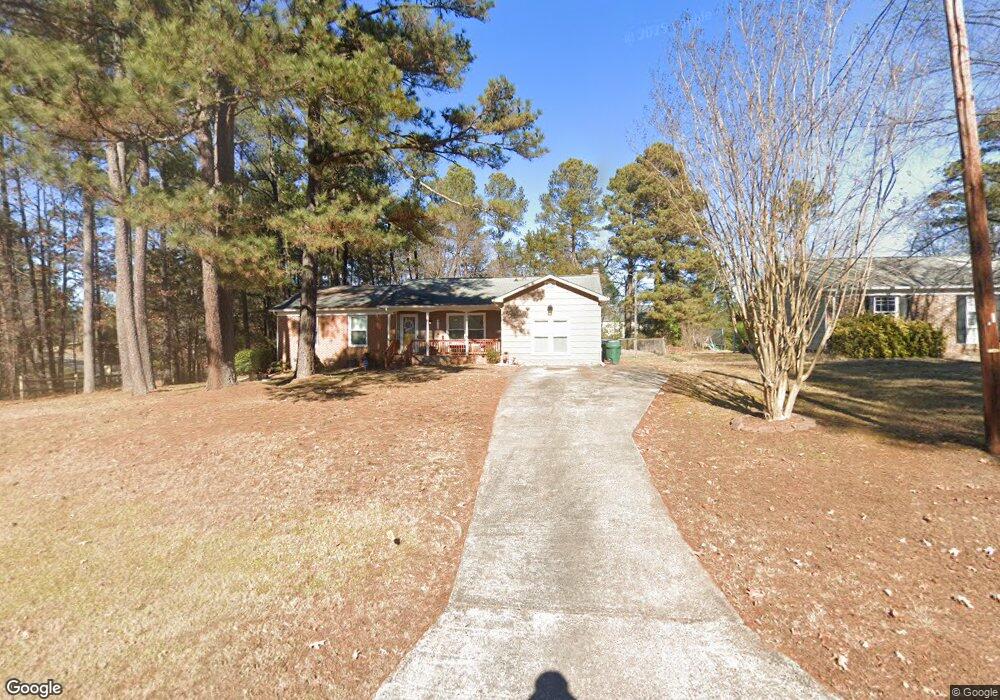
1301 Clermont Rd Durham, NC 27713
Estimated Value: $382,000 - $427,000
3
Beds
2
Baths
1,650
Sq Ft
$243/Sq Ft
Est. Value
About This Home
This home is located at 1301 Clermont Rd, Durham, NC 27713 and is currently estimated at $401,354, approximately $243 per square foot. 1301 Clermont Rd is a home located in Durham County with nearby schools including Parkwood Elementary, Lowe's Grove Middle, and Hillside High School.
Ownership History
Date
Name
Owned For
Owner Type
Purchase Details
Closed on
Apr 15, 2003
Sold by
Hammond Harvey Dean
Bought by
Saddler Walker Ingrid
Current Estimated Value
Home Financials for this Owner
Home Financials are based on the most recent Mortgage that was taken out on this home.
Original Mortgage
$115,200
Outstanding Balance
$53,997
Interest Rate
7%
Estimated Equity
$347,357
Purchase Details
Closed on
Jul 19, 2001
Sold by
Jarnagin David Stephen and Jarnagin Elizabeth A
Bought by
Hammond Harvey Dean
Home Financials for this Owner
Home Financials are based on the most recent Mortgage that was taken out on this home.
Original Mortgage
$135,857
Interest Rate
7.16%
Mortgage Type
FHA
Purchase Details
Closed on
Dec 29, 1999
Sold by
Yamaoka Larry H and Yamaoka Esther L
Bought by
Jarnagin David Stephen and Jarnagin Elizabeth A
Home Financials for this Owner
Home Financials are based on the most recent Mortgage that was taken out on this home.
Original Mortgage
$123,500
Interest Rate
8.21%
Create a Home Valuation Report for This Property
The Home Valuation Report is an in-depth analysis detailing your home's value as well as a comparison with similar homes in the area
Home Values in the Area
Average Home Value in this Area
Purchase History
| Date | Buyer | Sale Price | Title Company |
|---|---|---|---|
| Saddler Walker Ingrid | $144,000 | -- | |
| Hammond Harvey Dean | $138,000 | -- | |
| Jarnagin David Stephen | $130,000 | -- |
Source: Public Records
Mortgage History
| Date | Status | Borrower | Loan Amount |
|---|---|---|---|
| Open | Saddler Walker Ingrid | $115,200 | |
| Previous Owner | Hammond Harvey Dean | $135,857 | |
| Previous Owner | Jarnagin David Stephen | $123,500 | |
| Closed | Saddler Walker Ingrid | $28,800 |
Source: Public Records
Tax History Compared to Growth
Tax History
| Year | Tax Paid | Tax Assessment Tax Assessment Total Assessment is a certain percentage of the fair market value that is determined by local assessors to be the total taxable value of land and additions on the property. | Land | Improvement |
|---|---|---|---|---|
| 2025 | $3,761 | $379,366 | $141,000 | $238,366 |
| 2024 | $3,047 | $218,447 | $42,420 | $176,027 |
| 2023 | $2,861 | $218,447 | $42,420 | $176,027 |
| 2022 | $2,796 | $218,447 | $42,420 | $176,027 |
| 2021 | $2,783 | $218,447 | $42,420 | $176,027 |
| 2020 | $2,717 | $218,447 | $42,420 | $176,027 |
| 2019 | $2,717 | $218,447 | $42,420 | $176,027 |
| 2018 | $2,396 | $176,650 | $31,770 | $144,880 |
| 2017 | $2,379 | $176,650 | $31,770 | $144,880 |
| 2016 | $2,298 | $176,650 | $31,770 | $144,880 |
| 2015 | $2,032 | $146,793 | $37,650 | $109,143 |
| 2014 | $2,032 | $146,793 | $37,650 | $109,143 |
Source: Public Records
Map
Nearby Homes
- 1109 Seaton Rd
- 1227 Seaton Rd Unit 54
- 1304 Seaton Rd Unit 1
- 1304 Seaton Rd Unit 24
- 1021 Park Glen Place
- 5 Huckleberry Ct
- 1621 Clermont Rd
- 5504 Pelham Rd
- 5320 Newhall Rd
- 6353 Grandale Dr
- 9 Monteith Ct
- 5100 Mccormick Rd
- 7409 Chesley Ln
- 205 Landreth Ct
- 12 Haycox Ct
- 1445 Sedwick Rd
- 115 Lattimore Ln
- 1728 Euclid Rd
- 108 Ashmont Ln
- 5403 Lyon Farm Dr
- 1305 Clermont Rd
- 0 Grandale Rd Unit TR983056
- 1309 Clermont Rd
- 1222 Goldenview Ct
- 1300 Clermont Rd
- 114 Wenonah Way
- 116 Wenonah Way
- 1304 Clermont Rd
- 112 Wenonah Way
- 118 Wenonah Way
- 1221 Goldenview Ct
- 1220 Goldenview Ct
- 1313 Clermont Rd
- 1308 Clermont Rd
- 1209 Park Glen Place
- 110 Wenonah Way
- 200 Wenonah Way
- 1312 Clermont Rd
- 1219 Goldenview Ct
- 202 Wenonah Way