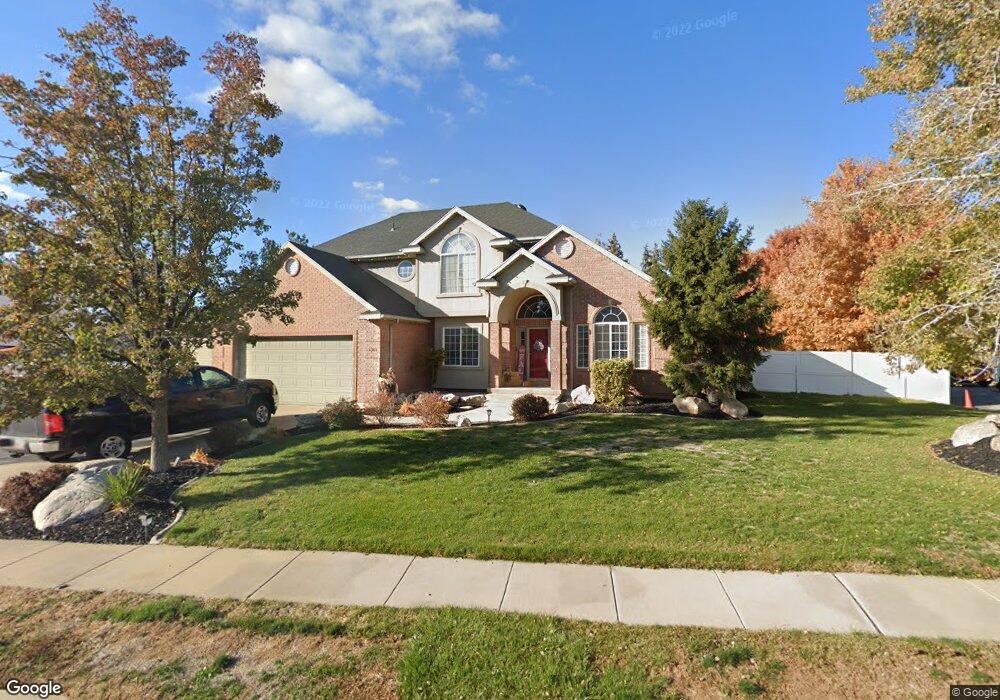
1301 E 575 N Layton, UT 84040
Estimated Value: $819,000 - $916,000
6
Beds
5
Baths
4,503
Sq Ft
$196/Sq Ft
Est. Value
About This Home
This home is located at 1301 E 575 N, Layton, UT 84040 and is currently estimated at $881,409, approximately $195 per square foot. 1301 E 575 N is a home located in Davis County with nearby schools including King Elementary School, Central Davis Junior High School, and Layton High School.
Ownership History
Date
Name
Owned For
Owner Type
Purchase Details
Closed on
May 21, 2020
Sold by
Pirtle Malynda
Bought by
Hoagland Jarrod and Hoagland Maria
Current Estimated Value
Home Financials for this Owner
Home Financials are based on the most recent Mortgage that was taken out on this home.
Original Mortgage
$503,405
Outstanding Balance
$446,087
Interest Rate
3.3%
Mortgage Type
New Conventional
Estimated Equity
$435,322
Purchase Details
Closed on
Aug 5, 2019
Sold by
Eker Aleksandra and Pirtle Malynda
Bought by
Pirtle Malynda
Home Financials for this Owner
Home Financials are based on the most recent Mortgage that was taken out on this home.
Original Mortgage
$414,000
Interest Rate
3.73%
Mortgage Type
New Conventional
Purchase Details
Closed on
Sep 7, 2017
Sold by
Roberts Scott and Roberts Heather J
Bought by
Eker Aleksandra and Pirtle Malynda
Purchase Details
Closed on
Mar 5, 2002
Sold by
Federal National Mortgage Association
Bought by
Roberts Scott
Home Financials for this Owner
Home Financials are based on the most recent Mortgage that was taken out on this home.
Original Mortgage
$216,500
Interest Rate
6.94%
Mortgage Type
Balloon
Purchase Details
Closed on
Nov 7, 2001
Sold by
Carraway Susan L
Bought by
Federal National Mortgage Association
Purchase Details
Closed on
Jul 13, 2000
Sold by
Carraway Susan L
Bought by
Carraway Benjamin and Carraway Susan L
Home Financials for this Owner
Home Financials are based on the most recent Mortgage that was taken out on this home.
Original Mortgage
$228,000
Interest Rate
8.37%
Purchase Details
Closed on
May 27, 1997
Sold by
Mcbride Lavarr W and Mcbride Lavaar W
Bought by
Mcbride Lavarr W and Mcbride Carol A
Home Financials for this Owner
Home Financials are based on the most recent Mortgage that was taken out on this home.
Original Mortgage
$214,600
Interest Rate
8.14%
Purchase Details
Closed on
May 23, 1997
Sold by
Mcbride Lavarr W and Mcbride Carol A
Bought by
Carraway Benjamin and Carraway Susan L
Home Financials for this Owner
Home Financials are based on the most recent Mortgage that was taken out on this home.
Original Mortgage
$214,600
Interest Rate
8.14%
Purchase Details
Closed on
Sep 9, 1996
Sold by
Kirk Darrell
Bought by
Mcbride Lavaar W and Mcbride Carol A
Purchase Details
Closed on
Aug 20, 1996
Sold by
Southridge Development Corp
Bought by
Kirk Darrell
Create a Home Valuation Report for This Property
The Home Valuation Report is an in-depth analysis detailing your home's value as well as a comparison with similar homes in the area
Home Values in the Area
Average Home Value in this Area
Purchase History
| Date | Buyer | Sale Price | Title Company |
|---|---|---|---|
| Hoagland Jarrod | -- | Backman Title Services Ltd | |
| Pirtle Malynda | -- | Inwest Title Service | |
| Eker Aleksandra | -- | -- | |
| Roberts Scott | -- | United Title Services | |
| Federal National Mortgage Association | $197,038 | First Southwestern Title | |
| Carraway Benjamin | -- | -- | |
| Carraway Susan L | -- | -- | |
| Mcbride Lavarr W | -- | First American Title Co | |
| Carraway Benjamin | -- | First American Title Co | |
| Mcbride Lavaar W | -- | First American Title Co | |
| Kirk Darrell | -- | Bonneville Title Company Inc |
Source: Public Records
Mortgage History
| Date | Status | Borrower | Loan Amount |
|---|---|---|---|
| Open | Hoagland Jarrod | $503,405 | |
| Previous Owner | Pirtle Malynda | $414,000 | |
| Previous Owner | Roberts Scott | $216,500 | |
| Previous Owner | Carraway Susan L | $228,000 | |
| Previous Owner | Carraway Benjamin | $214,600 |
Source: Public Records
Tax History
| Year | Tax Paid | Tax Assessment Tax Assessment Total Assessment is a certain percentage of the fair market value that is determined by local assessors to be the total taxable value of land and additions on the property. | Land | Improvement |
|---|---|---|---|---|
| 2025 | $4,771 | $462,550 | $141,869 | $320,681 |
| 2024 | $4,486 | $438,350 | $162,403 | $275,947 |
| 2023 | $4,463 | $773,000 | $212,287 | $560,713 |
| 2022 | $4,608 | $436,150 | $114,450 | $321,700 |
| 2021 | $4,228 | $595,000 | $175,115 | $419,885 |
| 2020 | $3,842 | $517,000 | $145,551 | $371,449 |
| 2019 | $3,670 | $485,000 | $129,202 | $355,798 |
| 2018 | $3,450 | $458,000 | $103,556 | $354,444 |
| 2016 | $3,004 | $208,120 | $56,572 | $151,548 |
| 2015 | $2,829 | $185,680 | $56,572 | $129,108 |
| 2014 | $2,725 | $182,662 | $56,572 | $126,090 |
| 2013 | -- | $164,686 | $38,806 | $125,880 |
Source: Public Records
Map
Nearby Homes
- 1503 E 530 N
- 479 N 1375 E
- 1515 E Gentile St
- 1033 E 825 N
- 508 N Adamswood Rd
- 997 E 825 N
- 1545 E 975 N
- 556 N Fairfield Rd Unit A2
- 556 N Fairfield Rd Unit D1
- 556 N Fairfield Rd Unit D2
- 556 N Fairfield Rd Unit A3
- 556 N Fairfield Rd Unit D3
- 556 N Fairfield Rd Unit D4
- 556 N Fairfield Rd Unit A1
- 556 N Fairfield Rd Unit A4
- 861 E 575 N
- 187 N Talbot Dr
- 1156 Cherrywood Dr
- 2877 E Gentile St Unit 2
- 1148 N 1875 E Unit 2
Your Personal Tour Guide
Ask me questions while you tour the home.