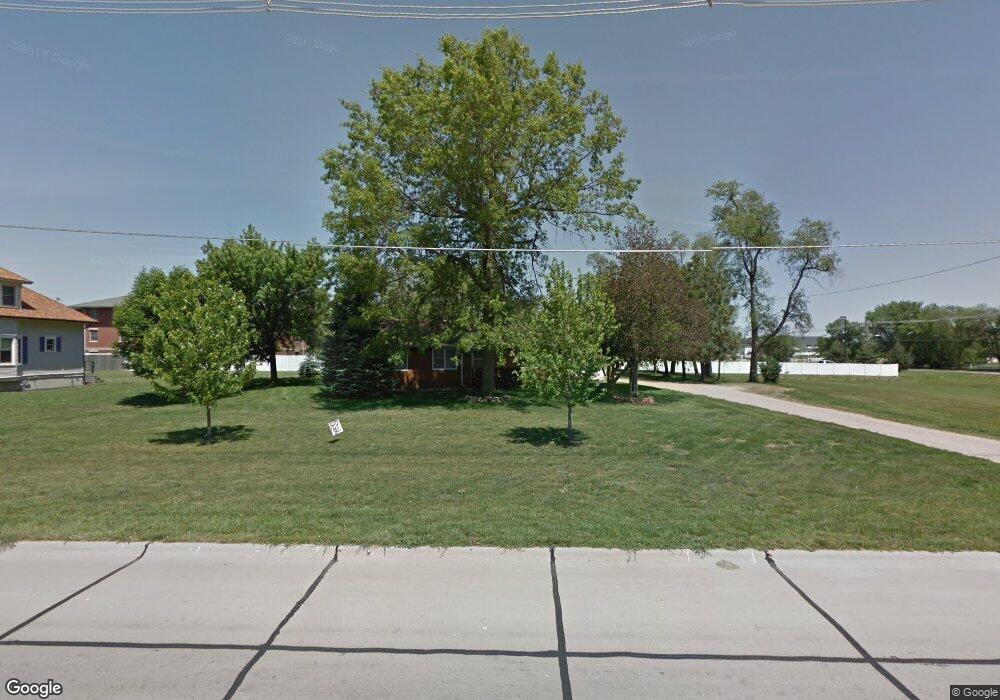
1301 E 9th St Hastings, NE 68901
Estimated Value: $253,000 - $272,000
3
Beds
2
Baths
1,590
Sq Ft
$166/Sq Ft
Est. Value
About This Home
This home is located at 1301 E 9th St, Hastings, NE 68901 and is currently estimated at $264,178, approximately $166 per square foot. 1301 E 9th St is a home located in Adams County with nearby schools including Hastings Senior High School, St. Michael's Preschool & Elementary School, and St. Cecilia High School.
Ownership History
Date
Name
Owned For
Owner Type
Purchase Details
Closed on
Mar 1, 2023
Sold by
Prinsen Troy Alan and Wa Mae
Bought by
Fox Jason Lee and Fox Karessa Ann
Current Estimated Value
Home Financials for this Owner
Home Financials are based on the most recent Mortgage that was taken out on this home.
Original Mortgage
$240,562
Outstanding Balance
$232,955
Interest Rate
6.09%
Mortgage Type
FHA
Estimated Equity
$31,223
Purchase Details
Closed on
Apr 25, 2021
Sold by
Anderson Treu G and Anderson Alexis
Bought by
Prinsen Troy Alan and Prinsen Iva Mae
Home Financials for this Owner
Home Financials are based on the most recent Mortgage that was taken out on this home.
Original Mortgage
$167,850
Interest Rate
3%
Mortgage Type
New Conventional
Purchase Details
Closed on
Jul 10, 2019
Sold by
Vap Pamela J
Bought by
Anderson Treu G
Home Financials for this Owner
Home Financials are based on the most recent Mortgage that was taken out on this home.
Original Mortgage
$172,660
Interest Rate
3.8%
Mortgage Type
New Conventional
Create a Home Valuation Report for This Property
The Home Valuation Report is an in-depth analysis detailing your home's value as well as a comparison with similar homes in the area
Home Values in the Area
Average Home Value in this Area
Purchase History
| Date | Buyer | Sale Price | Title Company |
|---|---|---|---|
| Fox Jason Lee | -- | -- | |
| Prinsen Troy Alan | $187,000 | Elizabeth Prairie Title | |
| Anderson Treu G | $178,000 | -- |
Source: Public Records
Mortgage History
| Date | Status | Borrower | Loan Amount |
|---|---|---|---|
| Open | Fox Jason Lee | $240,562 | |
| Previous Owner | Prinsen Troy Alan | $167,850 | |
| Previous Owner | Anderson Treu G | $172,660 | |
| Closed | Fox Jason Lee | $10,550 |
Source: Public Records
Tax History Compared to Growth
Tax History
| Year | Tax Paid | Tax Assessment Tax Assessment Total Assessment is a certain percentage of the fair market value that is determined by local assessors to be the total taxable value of land and additions on the property. | Land | Improvement |
|---|---|---|---|---|
| 2024 | $3,512 | $221,606 | $43,157 | $178,449 |
| 2023 | $4,527 | $219,377 | $43,157 | $176,220 |
| 2022 | $3,301 | $146,534 | $43,157 | $103,377 |
| 2021 | $2,763 | $125,991 | $34,507 | $91,484 |
| 2020 | $2,623 | $121,635 | $34,507 | $87,128 |
| 2019 | $2,558 | $119,927 | $34,507 | $85,420 |
| 2018 | $2,483 | $115,790 | $30,370 | $85,420 |
| 2017 | $2,411 | $112,505 | $0 | $0 |
| 2016 | $2,378 | $110,895 | $30,370 | $80,525 |
| 2011 | -- | $100,610 | $29,120 | $71,490 |
Source: Public Records
Map
Nearby Homes