1301 E Greenway Cir Mesa, AZ 85203
North Central Mesa NeighborhoodEstimated Value: $561,682 - $651,000
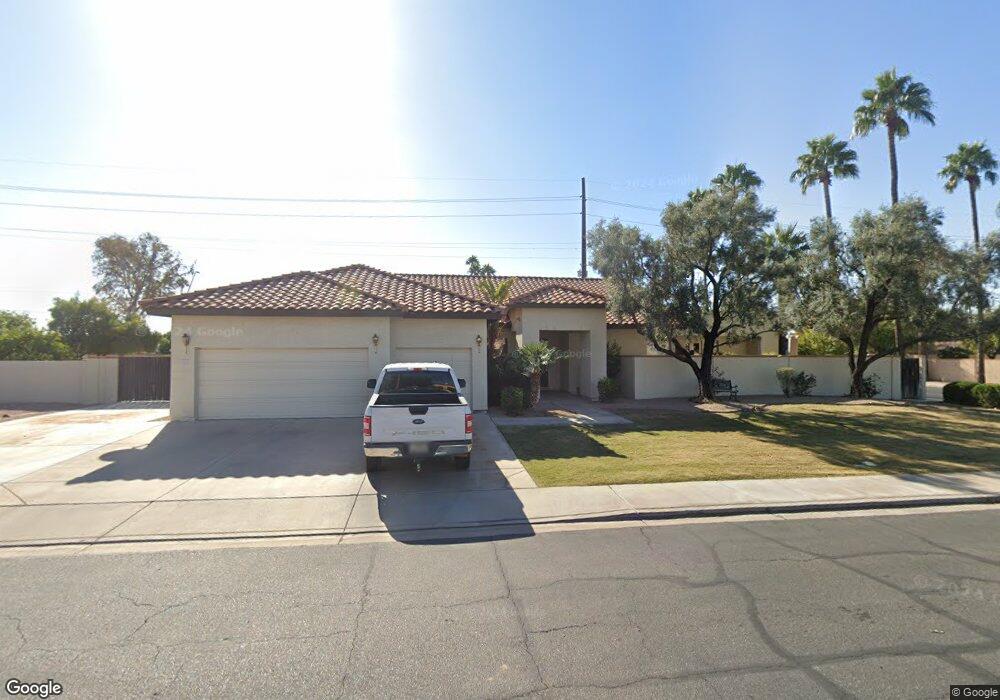
About This Home
This home is located at 1301 E Greenway Cir, Mesa, AZ 85203 and is currently estimated at $611,921, approximately $241 per square foot. 1301 E Greenway Cir is a home located in Maricopa County with nearby schools including Macarthur Elementary School, Franklin at Brimhall Elementary School, and Franklin West Elementary School.
Ownership History
We collect this data history from publicly available records. To have your information removed, we recommend requesting removal directly through your county’s website.
Purchase Details
Purchase Details
Purchase Details
Home Financials for this Owner
Home Financials are based on the most recent Mortgage that was taken out on this home.Purchase Details
Home Values in the Area
Average Home Value in this Area
Purchase History
We collect this data history from publicly available records. To have your information removed, we recommend requesting removal directly through your county’s website.
| Date | Buyer | Sale Price | Title Company |
|---|---|---|---|
| -- | None Available | ||
| -- | None Available | ||
| -- | First American Title | ||
| $34,000 | Chicago Title Insurance Co |
Mortgage History
We collect this data history from publicly available records. To have your information removed, we recommend requesting removal directly through your county’s website.
| Date | Status | Borrower | Loan Amount |
|---|---|---|---|
| Previous Owner | $132,300 |
Tax History
We collect this data history from publicly available records. To have your information removed, we recommend requesting removal directly through your county’s website.
| Year | Tax Paid | Tax Assessment Tax Assessment Total Assessment is a certain percentage of the fair market value that is determined by local assessors to be the total taxable value of land and additions on the property. | Land | Improvement |
|---|---|---|---|---|
| 2025 | $2,598 | $27,487 | -- | -- |
| 2024 | $2,720 | $26,178 | -- | -- |
| 2023 | $2,720 | $39,660 | $5,520 | $34,140 |
| 2022 | $2,664 | $31,530 | $4,390 | $27,140 |
| 2021 | $2,696 | $29,410 | $4,090 | $25,320 |
| 2020 | $2,661 | $27,640 | $3,850 | $23,790 |
| 2019 | $2,486 | $25,580 | $3,560 | $22,020 |
| 2018 | $2,386 | $23,590 | $3,280 | $20,310 |
| 2017 | $2,315 | $23,760 | $3,310 | $20,450 |
| 2016 | $1,925 | $23,840 | $3,320 | $20,520 |
| 2015 | $1,817 | $21,790 | $3,030 | $18,760 |
Map
- 1360 E Brown Rd Unit 28
- 1202 E Greenway Cir
- 1335 E Granada St
- 1232 E Granada St
- 1524 E Fairbrook St
- 1515 E Fountain St
- 1340 N Diane Cir
- 945 N Delmar
- 1304 E Hackamore St
- 1047 E Fairfield St
- 1036 E Fairfield St
- 1030 E Fairfield St
- 1625 E Greenway St
- 1701 E Greenway St
- 1254 E Hale St
- 1543 N Delmar
- 1335 E 8th St
- 1550 N Stapley Dr Unit 48
- 1550 N Stapley Dr Unit 67
- 953 E Hackamore St
- 1312 E Fairbrook St
- 1302 E Fairbrook St
- 1322 E Fairbrook St
- 1315 E Fairbrook St
- 1264 E Fairbrook St
- 1332 E Fairbrook St
- 1327 E Fairbrook St
- 1305 E Fairbrook St
- 1260 E Fairbrook St
- 1325 E Greenway Cir
- 1140 N Delmar
- 1263 E Fairbrook St
- 1342 E Fairbrook St
- 1320 E Fountain St
- 1155 N Diane St
- 1147 N Diane St
- 1328 E Fountain St
- 1130 N Delmar
- 1310 E Fountain St
- 1137 N Diane St
Ask me questions while you tour the home.