Estimated Value: $76,000 - $124,000
3
Beds
1
Bath
962
Sq Ft
$109/Sq Ft
Est. Value
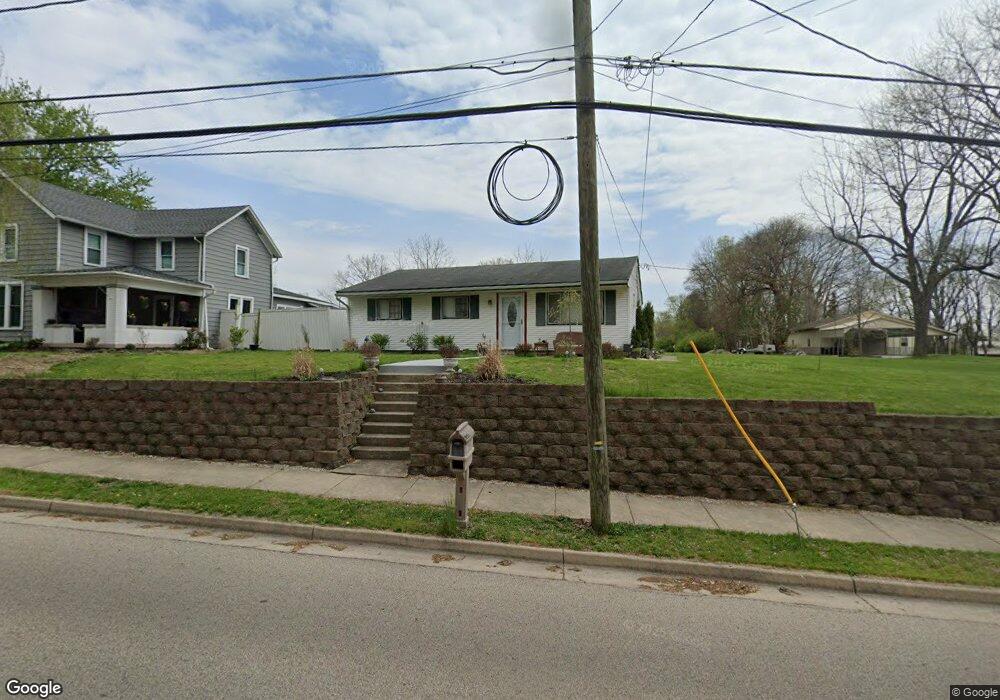
About This Home
This home is located at 1301 Echo Lake Dr, Piqua, OH 45356 and is currently estimated at $105,106, approximately $109 per square foot. 1301 Echo Lake Dr is a home located in Miami County with nearby schools including Washington Primary School, Piqua Junior High School, and Piqua High School.
Ownership History
Date
Name
Owned For
Owner Type
Purchase Details
Closed on
Oct 16, 2020
Sold by
Gilson Jack A
Bought by
Hall Elmer and Hall Penny
Current Estimated Value
Purchase Details
Closed on
Sep 16, 2019
Sold by
Towd Point Mortgage Trust
Bought by
Gilson Jack A
Home Financials for this Owner
Home Financials are based on the most recent Mortgage that was taken out on this home.
Original Mortgage
$52,725
Outstanding Balance
$34,966
Interest Rate
3.6%
Mortgage Type
New Conventional
Estimated Equity
$70,140
Purchase Details
Closed on
Aug 1, 2019
Sold by
Doe John
Bought by
Us Bank National Asociation and Towd Point Mortgagee Trust
Home Financials for this Owner
Home Financials are based on the most recent Mortgage that was taken out on this home.
Original Mortgage
$52,725
Outstanding Balance
$34,966
Interest Rate
3.6%
Mortgage Type
New Conventional
Estimated Equity
$70,140
Purchase Details
Closed on
Jan 1, 1990
Bought by
Cassel Harley M
Create a Home Valuation Report for This Property
The Home Valuation Report is an in-depth analysis detailing your home's value as well as a comparison with similar homes in the area
Home Values in the Area
Average Home Value in this Area
Purchase History
| Date | Buyer | Sale Price | Title Company |
|---|---|---|---|
| Hall Elmer | $53,000 | None Available | |
| Gilson Jack A | $55,500 | Servicelink | |
| Us Bank National Asociation | $45,101 | None Available | |
| Cassel Harley M | -- | -- |
Source: Public Records
Mortgage History
| Date | Status | Borrower | Loan Amount |
|---|---|---|---|
| Open | Gilson Jack A | $52,725 |
Source: Public Records
Tax History Compared to Growth
Tax History
| Year | Tax Paid | Tax Assessment Tax Assessment Total Assessment is a certain percentage of the fair market value that is determined by local assessors to be the total taxable value of land and additions on the property. | Land | Improvement |
|---|---|---|---|---|
| 2024 | $925 | $22,510 | $6,720 | $15,790 |
| 2023 | $925 | $22,510 | $6,720 | $15,790 |
| 2022 | $941 | $22,510 | $6,720 | $15,790 |
| 2021 | $895 | $19,570 | $5,850 | $13,720 |
| 2020 | $877 | $19,570 | $5,850 | $13,720 |
| 2019 | $668 | $23,590 | $8,680 | $14,910 |
| 2018 | $534 | $20,060 | $7,350 | $12,710 |
| 2017 | $540 | $20,060 | $7,350 | $12,710 |
| 2016 | $534 | $20,060 | $7,350 | $12,710 |
| 2015 | $547 | $20,060 | $7,350 | $12,710 |
| 2014 | $547 | $20,060 | $7,350 | $12,710 |
| 2013 | $548 | $20,060 | $7,350 | $12,710 |
Source: Public Records
Map
Nearby Homes
- 1303 Echo Lake Dr
- 1307 Echo Lake Dr
- 1211 Echo Lake Dr
- 1124 Anderson St
- 1306 Echo Lake Dr
- 1206 Echo Lake Dr
- 1204 Echo Lake Dr
- 1300 Echo Lake Dr
- 1118 Anderson St
- 1308 Echo Lake Dr
- 1203 Echo Lake Dr
- 1401 Echo Lake Dr
- 1129 Anderson St
- 1127 Anderson St
- 1403 Echo Lake Dr
- 1125 Anderson St
- 1123 Echo Lake Dr
- 1400 Echo Lake Dr
- 1114 Anderson St
- 1123 Anderson St