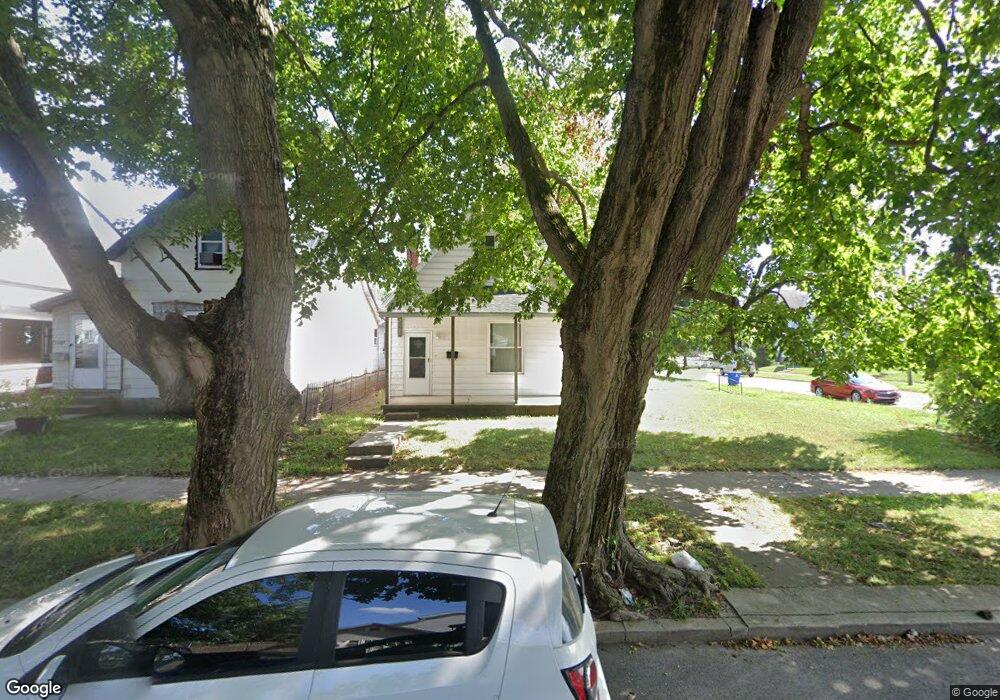
1301 George St Logansport, IN 46947
Estimated Value: $99,000 - $162,000
1
Bed
1
Bath
2,204
Sq Ft
$57/Sq Ft
Est. Value
About This Home
This home is located at 1301 George St, Logansport, IN 46947 and is currently estimated at $126,672, approximately $57 per square foot. 1301 George St is a home located in Cass County with nearby schools including Logansport Community High School and All Saints Catholic School.
Ownership History
Date
Name
Owned For
Owner Type
Purchase Details
Closed on
Jan 30, 2025
Sold by
Gutierez Maximo
Bought by
Dominguez Eloseyda Y Perez
Current Estimated Value
Home Financials for this Owner
Home Financials are based on the most recent Mortgage that was taken out on this home.
Original Mortgage
$68,400
Outstanding Balance
$67,978
Interest Rate
6.72%
Mortgage Type
New Conventional
Estimated Equity
$58,694
Purchase Details
Closed on
Apr 10, 2024
Sold by
Sheriff Of Cass County
Bought by
Gutierez Maximo
Create a Home Valuation Report for This Property
The Home Valuation Report is an in-depth analysis detailing your home's value as well as a comparison with similar homes in the area
Home Values in the Area
Average Home Value in this Area
Purchase History
| Date | Buyer | Sale Price | Title Company |
|---|---|---|---|
| Dominguez Eloseyda Y Perez | $85,500 | None Listed On Document | |
| Gutierez Maximo | $52,000 | None Listed On Document |
Source: Public Records
Mortgage History
| Date | Status | Borrower | Loan Amount |
|---|---|---|---|
| Open | Dominguez Eloseyda Y Perez | $68,400 |
Source: Public Records
Tax History Compared to Growth
Tax History
| Year | Tax Paid | Tax Assessment Tax Assessment Total Assessment is a certain percentage of the fair market value that is determined by local assessors to be the total taxable value of land and additions on the property. | Land | Improvement |
|---|---|---|---|---|
| 2024 | $1,200 | $67,100 | $8,900 | $58,200 |
| 2023 | $1,200 | $60,000 | $8,900 | $51,100 |
| 2022 | $1,106 | $55,300 | $8,900 | $46,400 |
| 2021 | $486 | $49,200 | $8,900 | $40,300 |
| 2020 | $354 | $43,900 | $8,900 | $35,000 |
| 2019 | $373 | $42,300 | $8,900 | $33,400 |
| 2018 | $325 | $40,200 | $8,900 | $31,300 |
| 2017 | $331 | $39,800 | $10,500 | $29,300 |
| 2016 | $268 | $36,700 | $10,500 | $26,200 |
| 2014 | $318 | $41,100 | $10,500 | $30,600 |
| 2013 | $318 | $41,900 | $10,500 | $31,400 |
Source: Public Records
Map
Nearby Homes