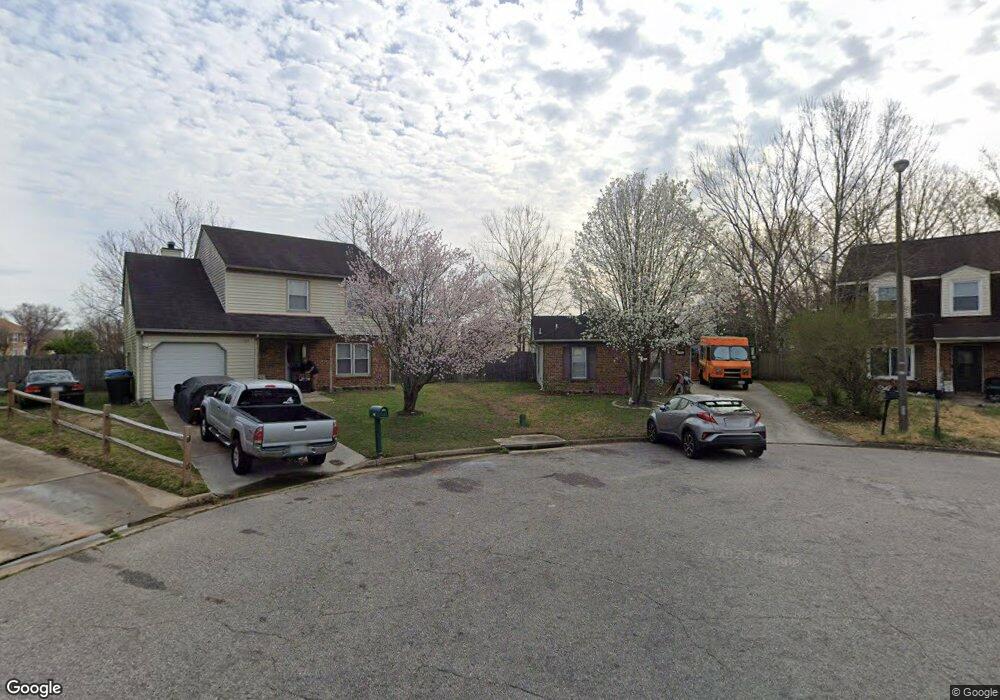
1301 Graylyn Ct Virginia Beach, VA 23464
Estimated Value: $347,508 - $355,000
3
Beds
2
Baths
1,331
Sq Ft
$265/Sq Ft
Est. Value
About This Home
This home is located at 1301 Graylyn Ct, Virginia Beach, VA 23464 and is currently estimated at $352,127, approximately $264 per square foot. 1301 Graylyn Ct is a home located in Virginia Beach City with nearby schools including Glenwood Elementary School, Salem Middle School, and Salem High School.
Ownership History
Date
Name
Owned For
Owner Type
Purchase Details
Closed on
Jan 6, 2021
Sold by
Scally Sean D and Scally Alexandria R
Bought by
Chen Yanhui
Current Estimated Value
Home Financials for this Owner
Home Financials are based on the most recent Mortgage that was taken out on this home.
Original Mortgage
$265,980
Outstanding Balance
$237,346
Interest Rate
2.7%
Mortgage Type
New Conventional
Estimated Equity
$114,781
Purchase Details
Closed on
Dec 28, 2020
Sold by
Scally Sean D and Scally Alexandria R
Bought by
Chen Yanhui
Home Financials for this Owner
Home Financials are based on the most recent Mortgage that was taken out on this home.
Original Mortgage
$265,980
Outstanding Balance
$237,346
Interest Rate
2.7%
Mortgage Type
New Conventional
Estimated Equity
$114,781
Purchase Details
Closed on
Jul 20, 2016
Sold by
Sillman John N
Bought by
Scally Sean D and Scally Alexandria R
Home Financials for this Owner
Home Financials are based on the most recent Mortgage that was taken out on this home.
Original Mortgage
$224,700
Interest Rate
3.54%
Mortgage Type
VA
Purchase Details
Closed on
Oct 21, 2008
Sold by
Watson Gregory L
Bought by
Sillman John N
Home Financials for this Owner
Home Financials are based on the most recent Mortgage that was taken out on this home.
Original Mortgage
$205,321
Interest Rate
5.94%
Mortgage Type
VA
Purchase Details
Closed on
Sep 21, 2006
Sold by
Edwards William A
Bought by
Watson Gregory L
Home Financials for this Owner
Home Financials are based on the most recent Mortgage that was taken out on this home.
Original Mortgage
$211,330
Interest Rate
6.54%
Mortgage Type
FHA
Purchase Details
Closed on
Feb 23, 2005
Sold by
Thomas James R
Bought by
Edwards William A
Home Financials for this Owner
Home Financials are based on the most recent Mortgage that was taken out on this home.
Original Mortgage
$187,000
Interest Rate
5.66%
Mortgage Type
New Conventional
Purchase Details
Closed on
Feb 28, 2002
Sold by
New Life Dev Inc
Bought by
Thomas James
Home Financials for this Owner
Home Financials are based on the most recent Mortgage that was taken out on this home.
Original Mortgage
$117,150
Interest Rate
6.85%
Mortgage Type
VA
Purchase Details
Closed on
Nov 27, 2001
Sold by
Sec Housing And Urban Dev
Bought by
New Life Dev Inc
Home Financials for this Owner
Home Financials are based on the most recent Mortgage that was taken out on this home.
Original Mortgage
$91,500
Interest Rate
6.6%
Create a Home Valuation Report for This Property
The Home Valuation Report is an in-depth analysis detailing your home's value as well as a comparison with similar homes in the area
Home Values in the Area
Average Home Value in this Area
Purchase History
| Date | Buyer | Sale Price | Title Company |
|---|---|---|---|
| Chen Yanhui | $260,000 | Stewart Title Guaranty Co | |
| Chen Yanhui | $260,000 | Stewart Title Guaranty Co | |
| Scally Sean D | $22,000,000 | Attorney | |
| Sillman John N | $201,000 | -- | |
| Watson Gregory L | $213,000 | -- | |
| Edwards William A | $187,900 | -- | |
| Thomas James | $114,900 | -- | |
| New Life Dev Inc | $91,500 | -- |
Source: Public Records
Mortgage History
| Date | Status | Borrower | Loan Amount |
|---|---|---|---|
| Open | Chen Yanhui | $265,980 | |
| Closed | Chen Yanhui | $265,980 | |
| Previous Owner | Scally Sean D | $224,700 | |
| Previous Owner | Sillman John N | $205,321 | |
| Previous Owner | Watson Gregory L | $211,330 | |
| Previous Owner | Edwards William A | $187,000 | |
| Previous Owner | Thomas James | $117,150 | |
| Previous Owner | New Life Dev Inc | $91,500 |
Source: Public Records
Tax History Compared to Growth
Tax History
| Year | Tax Paid | Tax Assessment Tax Assessment Total Assessment is a certain percentage of the fair market value that is determined by local assessors to be the total taxable value of land and additions on the property. | Land | Improvement |
|---|---|---|---|---|
| 2025 | $2,960 | $308,200 | $120,000 | $188,200 |
| 2024 | $2,960 | $305,200 | $115,000 | $190,200 |
| 2023 | $2,900 | $292,900 | $100,000 | $192,900 |
| 2022 | $2,636 | $266,300 | $100,000 | $166,300 |
| 2021 | $2,294 | $231,700 | $88,000 | $143,700 |
| 2020 | $2,316 | $227,600 | $83,000 | $144,600 |
| 2019 | $2,261 | $214,100 | $78,000 | $136,100 |
| 2018 | $2,146 | $214,100 | $78,000 | $136,100 |
| 2017 | $1,917 | $191,200 | $74,000 | $117,200 |
| 2016 | $1,893 | $191,200 | $74,000 | $117,200 |
| 2015 | $1,804 | $182,200 | $72,400 | $109,800 |
| 2014 | $1,656 | $178,100 | $80,400 | $97,700 |
Source: Public Records
Map
Nearby Homes
- 1341 Sagamore Ct
- 1421 Eddystone Dr Unit X9192
- 1936 Southaven Dr
- 1367 Hafford Rd
- 1324 Hafford Rd
- 1232 Northvale Dr
- 1445 Marmora Rd
- 1339 Orillia Rd
- 2020 Lyndora Rd
- 2100 Rydale Ct
- 2148 Dove Ridge Dr
- 2008 Hopi Ct
- 5149 Rugby Rd
- 1912 Bunnell Ct
- 1536 Drumheller Dr
- 4736 Ardmore Ln
- 4748 Ardmore Ln
- 1617 Sweet Bay Ct
- 1550 Sangaree Cir
- 4764 Ardmore Ln
- 1305 Graylyn Ct
- 1300 Graylyn Ct
- 1309 Graylyn Ct
- 1304 Graylyn Ct
- 1300 Smyrna Cir
- 1304 Smyrna Cir
- 1313 Graylyn Ct
- 1208 Sydenham Ct
- 1308 Smyrna Cir
- 1308 Graylyn Ct
- 1209 Renfrew St
- 1212 Sydenham Ct
- 1312 Smyrna Cir
- 1317 Graylyn Ct
- 1312 Graylyn Ct
- 1316 Smyrna Cir
- 1204 Sydenham Ct
- 1301 Sharbot Dr
- 1305 Sharbot Dr
- 1205 Renfrew St