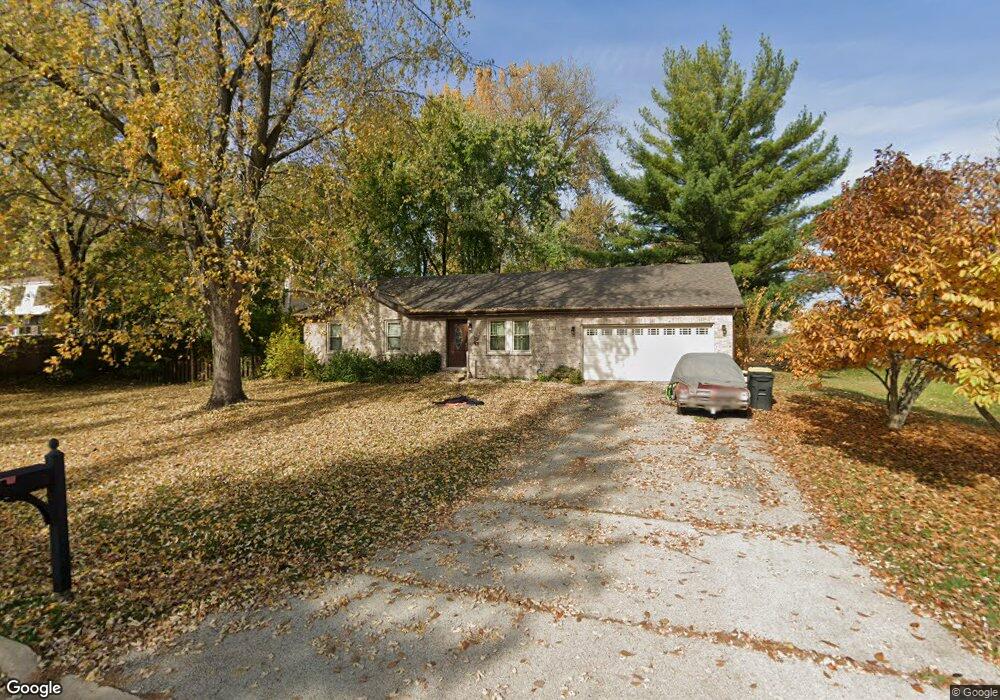
1301 Jefferson St Unit 9 Lake In the Hills, IL 60156
Estimated Value: $265,384 - $318,000
3
Beds
2
Baths
1,040
Sq Ft
$283/Sq Ft
Est. Value
About This Home
This home is located at 1301 Jefferson St Unit 9, Lake In the Hills, IL 60156 and is currently estimated at $294,346, approximately $283 per square foot. 1301 Jefferson St Unit 9 is a home located in McHenry County with nearby schools including Indian Prairie Elementary School, Lundahl Middle School, and Crystal Lake South High School.
Ownership History
Date
Name
Owned For
Owner Type
Purchase Details
Closed on
Jun 18, 2024
Sold by
Mikul Gina
Bought by
Mikul Sloan
Current Estimated Value
Purchase Details
Closed on
Sep 29, 1995
Sold by
Stephen Scott S and Stephen Cynthia C
Bought by
Mikul Robert E and Mikul Gina M
Home Financials for this Owner
Home Financials are based on the most recent Mortgage that was taken out on this home.
Original Mortgage
$117,000
Outstanding Balance
$853
Interest Rate
8%
Estimated Equity
$293,493
Purchase Details
Closed on
Oct 4, 1994
Sold by
Moore Steven Alexander and Moore Tracy Lynn
Bought by
Stephen Scott S and Stephen Cynthia C
Home Financials for this Owner
Home Financials are based on the most recent Mortgage that was taken out on this home.
Original Mortgage
$112,500
Interest Rate
5.25%
Create a Home Valuation Report for This Property
The Home Valuation Report is an in-depth analysis detailing your home's value as well as a comparison with similar homes in the area
Home Values in the Area
Average Home Value in this Area
Purchase History
| Date | Buyer | Sale Price | Title Company |
|---|---|---|---|
| Mikul Sloan | -- | None Listed On Document | |
| Mikul Robert E | $131,000 | -- | |
| Stephen Scott S | $125,000 | Intercounty Title |
Source: Public Records
Mortgage History
| Date | Status | Borrower | Loan Amount |
|---|---|---|---|
| Open | Mikul Robert E | $117,000 | |
| Previous Owner | Stephen Scott S | $112,500 |
Source: Public Records
Tax History Compared to Growth
Tax History
| Year | Tax Paid | Tax Assessment Tax Assessment Total Assessment is a certain percentage of the fair market value that is determined by local assessors to be the total taxable value of land and additions on the property. | Land | Improvement |
|---|---|---|---|---|
| 2024 | $6,342 | $81,299 | $11,043 | $70,256 |
| 2023 | $6,099 | $72,712 | $9,877 | $62,835 |
| 2022 | $5,903 | $66,740 | $8,914 | $57,826 |
| 2021 | $5,572 | $62,176 | $8,304 | $53,872 |
| 2020 | $5,446 | $59,975 | $8,010 | $51,965 |
| 2019 | $5,273 | $57,404 | $7,667 | $49,737 |
| 2018 | $4,224 | $46,069 | $14,270 | $31,799 |
| 2017 | $4,201 | $43,400 | $13,443 | $29,957 |
| 2016 | $4,091 | $40,705 | $12,608 | $28,097 |
| 2013 | -- | $43,967 | $11,761 | $32,206 |
Source: Public Records
Map
Nearby Homes
- 10 Lincoln St
- 275 Indian Trail
- 1114 Ash St
- 212 Village Creek Dr
- 528 Penny Ln
- 215 Indian Trail
- 70 Hilltop Dr Unit 4
- 1549 Brompton Ln
- 101 Oakleaf Rd
- 113 Pheasant Trail
- 1734 Somerfield Ln
- 1391 Acadia Cir
- 1345 Cunat Ct Unit 1B
- 1345 Cunat Ct Unit 2D
- 1108 Heavens Gate
- 1644 Stockton Ln
- 1549 Hollytree Ln Unit 2
- 1279 Merrimack Ct
- 1354 Cunat Ct Unit 3G
- 1049 Horizon Ridge
- 1303 Jefferson St
- 1305 Jefferson St
- 6 Miller Rd Unit 3
- 6 Miller Rd Unit C
- 6 Miller Rd
- 1221 Crystal Lake Rd
- 1306 Adams St
- 1308 Adams St
- 1219 Crystal Lake Rd
- 1309 Jefferson St
- 1219 Decatur Ave
- 1310 Adams St
- 1217 Crystal Lake Rd
- 1311 Jefferson St
- 1301 Adams St
- 1312 Adams St
- 6 Pershing Ave Unit 11
- 1305 Adams St
- 1307 Adams St Unit 9