Estimated Value: $546,867 - $568,000
3
Beds
3
Baths
3,622
Sq Ft
$154/Sq Ft
Est. Value
About This Home
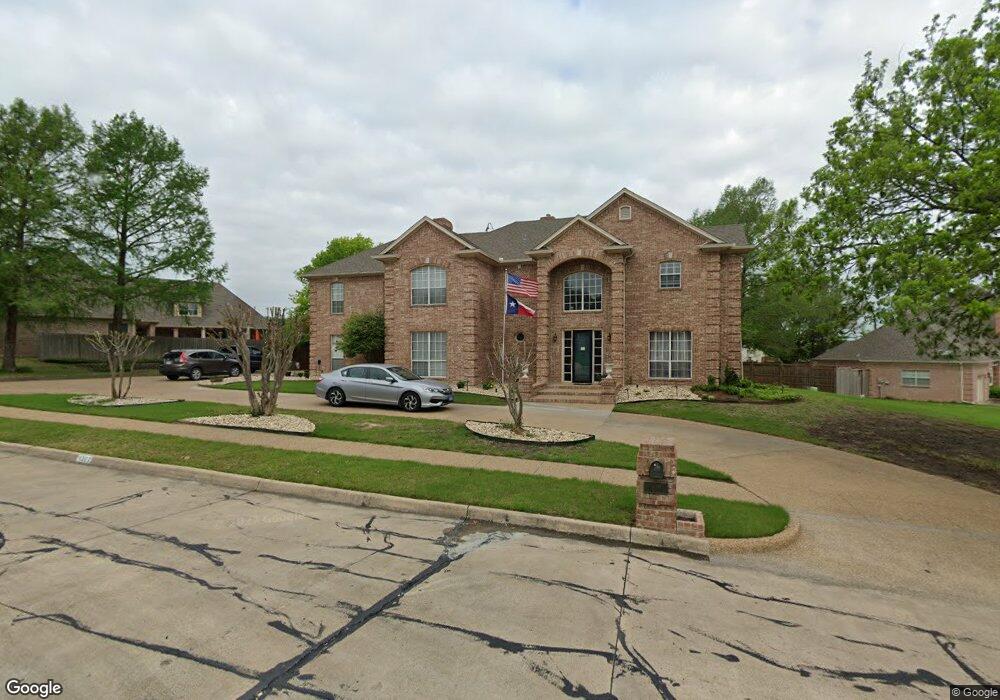
This home is located at 1301 Lakeridge Dr, Ennis, TX 75119 and is currently estimated at $557,434, approximately $153 per square foot. 1301 Lakeridge Dr is a home located in Ellis County with nearby schools including Bowie Elementary School, Jack Lummus Intermediate School, and Ennis Junior High School.
Ownership History
Date
Name
Owned For
Owner Type
Purchase Details
Closed on
Jun 6, 2022
Sold by
Hpa Ii Texas Sub 2021-1 Llc
Bought by
Griffin Michael and Griffin Julianne
Current Estimated Value
Home Financials for this Owner
Home Financials are based on the most recent Mortgage that was taken out on this home.
Original Mortgage
$419,952
Outstanding Balance
$398,989
Interest Rate
5.1%
Mortgage Type
FHA
Estimated Equity
$158,445
Purchase Details
Closed on
Jan 24, 2019
Sold by
Culpepper Kevin D and Culpepper Misty S
Bought by
Kcq Investments Llc
Purchase Details
Closed on
Jun 27, 2012
Sold by
Trojacek Katherine Marie and Trojacek Katherine Marie
Bought by
Culpepper Kevin D and Culpepper Misty S
Home Financials for this Owner
Home Financials are based on the most recent Mortgage that was taken out on this home.
Original Mortgage
$248,000
Interest Rate
3.8%
Mortgage Type
New Conventional
Create a Home Valuation Report for This Property
The Home Valuation Report is an in-depth analysis detailing your home's value as well as a comparison with similar homes in the area
Home Values in the Area
Average Home Value in this Area
Purchase History
| Date | Buyer | Sale Price | Title Company |
|---|---|---|---|
| Griffin Michael | -- | None Listed On Document | |
| Kcq Investments Llc | -- | Providence Title Company | |
| Culpepper Kevin D | -- | Lawyers Title |
Source: Public Records
Mortgage History
| Date | Status | Borrower | Loan Amount |
|---|---|---|---|
| Open | Griffin Michael | $419,952 | |
| Previous Owner | Culpepper Kevin D | $248,000 | |
| Closed | Kcq Investments Llc | $0 |
Source: Public Records
Tax History Compared to Growth
Tax History
| Year | Tax Paid | Tax Assessment Tax Assessment Total Assessment is a certain percentage of the fair market value that is determined by local assessors to be the total taxable value of land and additions on the property. | Land | Improvement |
|---|---|---|---|---|
| 2025 | $10,354 | $558,557 | $85,000 | $473,557 |
| 2024 | $10,354 | $539,697 | $80,000 | $459,697 |
| 2023 | $10,354 | $574,438 | $80,000 | $494,438 |
| 2022 | $10,580 | $442,096 | $72,500 | $369,596 |
| 2021 | $9,686 | $384,750 | $60,000 | $324,750 |
| 2020 | $9,864 | $383,300 | $68,250 | $315,050 |
| 2019 | $10,081 | $384,700 | $0 | $0 |
| 2018 | $8,900 | $356,430 | $58,000 | $298,430 |
| 2017 | $8,977 | $338,440 | $58,000 | $280,440 |
| 2016 | $8,456 | $318,770 | $58,000 | $260,770 |
| 2015 | $7,978 | $312,310 | $58,000 | $254,310 |
| 2014 | $7,978 | $312,080 | $0 | $0 |
Source: Public Records
Map
Nearby Homes
- 2100 Lakeridge Cir
- 807 Williamsburg Dr
- 2311 Sherwood Dr
- 803 Williamsburg Dr
- 905 Royse Ridge Rd
- 1103 Sunset Dr
- 2402 Country Club Rd
- 1509 Lyndale Dr
- 805 Loy Ln
- 1600 W Ennis Ave
- 2503 Saint Andrews Dr
- 811 N Gaines St
- 2703 Sleepy Hollow Rd
- 536 Lakeshore Dr
- 1207 Louise Ln
- 1011 W Brown St
- 711 W Knox St
- 507 Lakeshore Dr
- 2800 Boyd St
- 1709 Carnoustie Dr
- 2000 Lakeridge Cir
- 2001 W Baldridge St
- 2005 W Baldridge St
- 2101 W Baldridge St
- 1300 Lakeridge Dr
- 2002 Lakeridge Cir
- 2103 W Baldridge St
- 1202 Lakeridge Dr
- 1903 W Baldridge St
- 2001 Lakeridge Cir
- 2004 Lakeridge Cir
- 2105 W Baldridge St
- 1905 Cedar Ridge Cir
- 2003 Lakeridge Cir
- 1900 Cedar Ridge Cir
- 1908 Clearview Dr
- 1906 Clearview Dr
- 1903 Cedar Ridge Cir
- 1904 Clearview Dr
- 2000 Clearview Dr