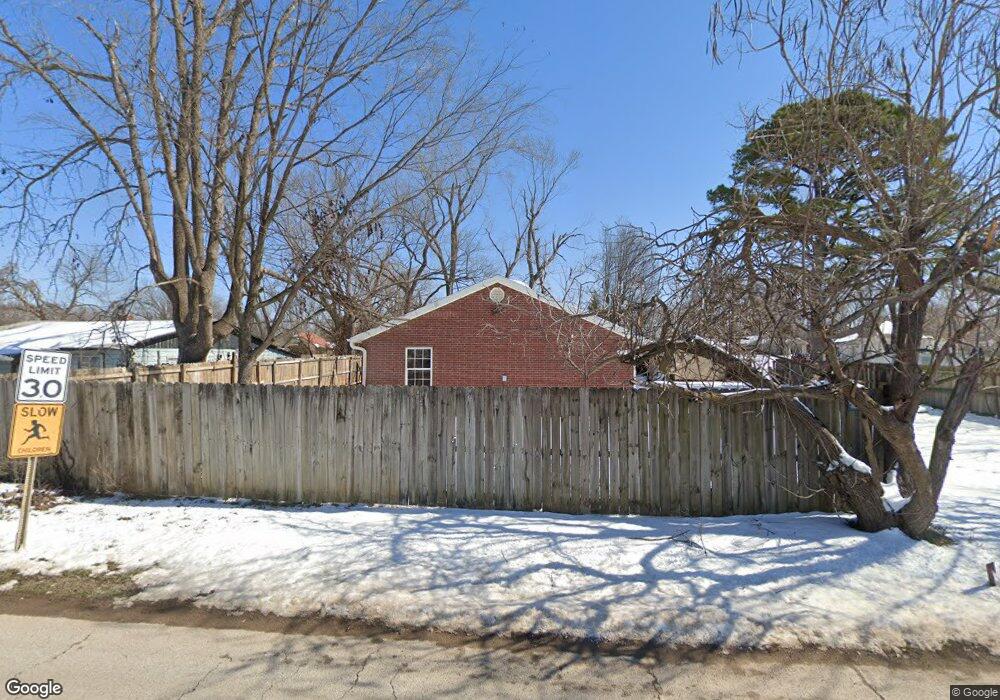
1301 N Arkansas St Rogers, AR 72756
Estimated Value: $263,000 - $308,000
--
Bed
2
Baths
1,500
Sq Ft
$189/Sq Ft
Est. Value
About This Home
This home is located at 1301 N Arkansas St, Rogers, AR 72756 and is currently estimated at $284,006, approximately $189 per square foot. 1301 N Arkansas St is a home located in Benton County with nearby schools including Frank Tillery Elementary School, Lingle Middle School, and Rogers Heritage High School.
Ownership History
Date
Name
Owned For
Owner Type
Purchase Details
Closed on
Mar 13, 2006
Sold by
Torres Refugio and Guerrero Violeta
Bought by
Torres Refugio and Guerrero Violeta
Current Estimated Value
Purchase Details
Closed on
Apr 5, 2002
Bought by
Torrez
Purchase Details
Closed on
Feb 15, 2001
Bought by
Rosas
Purchase Details
Closed on
Mar 5, 1999
Bought by
Hud
Purchase Details
Closed on
Jan 22, 1999
Bought by
Hud
Purchase Details
Closed on
Jun 30, 1992
Bought by
Mars
Purchase Details
Closed on
Nov 3, 1986
Bought by
Mars
Purchase Details
Closed on
May 2, 1986
Bought by
Mars
Purchase Details
Closed on
Apr 30, 1986
Bought by
Superior Federal Bank
Purchase Details
Closed on
Jan 6, 1986
Bought by
Fogle Fogle and Fogle Brandon
Purchase Details
Closed on
Oct 30, 1985
Bought by
Fogle Fogle and Fogle Brandon
Purchase Details
Closed on
Oct 24, 1985
Bought by
Brandon and Brandon Fogle
Create a Home Valuation Report for This Property
The Home Valuation Report is an in-depth analysis detailing your home's value as well as a comparison with similar homes in the area
Home Values in the Area
Average Home Value in this Area
Purchase History
| Date | Buyer | Sale Price | Title Company |
|---|---|---|---|
| Torres Refugio | -- | None Available | |
| Torrez | $10,000 | -- | |
| Rosas | -- | -- | |
| Hud | -- | -- | |
| Hud | -- | -- | |
| Mars | -- | -- | |
| Mars | -- | -- | |
| Mars | $22,000 | -- | |
| Superior Federal Bank | -- | -- | |
| Fogle Fogle | -- | -- | |
| Fogle Fogle | -- | -- | |
| Brandon | -- | -- |
Source: Public Records
Tax History Compared to Growth
Tax History
| Year | Tax Paid | Tax Assessment Tax Assessment Total Assessment is a certain percentage of the fair market value that is determined by local assessors to be the total taxable value of land and additions on the property. | Land | Improvement |
|---|---|---|---|---|
| 2025 | $1,567 | $55,207 | $8,000 | $47,207 |
| 2024 | $1,396 | $55,207 | $8,000 | $47,207 |
| 2023 | $1,329 | $36,750 | $8,000 | $28,750 |
| 2022 | $947 | $36,750 | $8,000 | $28,750 |
| 2021 | $884 | $36,750 | $8,000 | $28,750 |
| 2020 | $825 | $21,860 | $1,400 | $20,460 |
| 2019 | $825 | $21,860 | $1,400 | $20,460 |
| 2018 | $850 | $21,860 | $1,400 | $20,460 |
| 2017 | $785 | $21,860 | $1,400 | $20,460 |
| 2016 | $785 | $21,860 | $1,400 | $20,460 |
| 2015 | $1,520 | $30,540 | $2,600 | $27,940 |
| 2014 | $1,170 | $30,540 | $2,600 | $27,940 |
Source: Public Records
Map
Nearby Homes
- 1409 N Arkansas St
- 1403 N D St
- 715 N C St
- 1707 N C St
- 615 Prairie Creek Dr
- 753 N 6th St
- 509 N 3rd St
- 606 Will Rogers Dr
- 709 N 6th St
- 707 N 6th St
- 0 N C St
- 418,420,422,424 N F St
- 415 W Persimmon St
- 832 E Hilltop Dr
- 804 N 7th St
- 209 N C St
- 510 W Persimmon St
- 906 N 8th St
- 1420 Woodland Dr
- 201 E Walnut St
- 1211 N Arkansas St
- 1101 N Arkansas St
- 1200 N B St
- 1216 N B St
- 212 E North St
- 1005 N Arkansas St
- 1219 N Arkansas St
- 1220 N B St
- 1201 N B St
- 1203 N B St
- 1207 N B St
- 1207.5 N "B" St
- 1205 N B St
- 1221 N Arkansas St
- 2.2Ac E Union St
- 1.66Ac E Union St
- 1270 1/2 N B St
- 323 N 2 Nd St North St
- 1207 1/2 N B St
- 1224 N B St