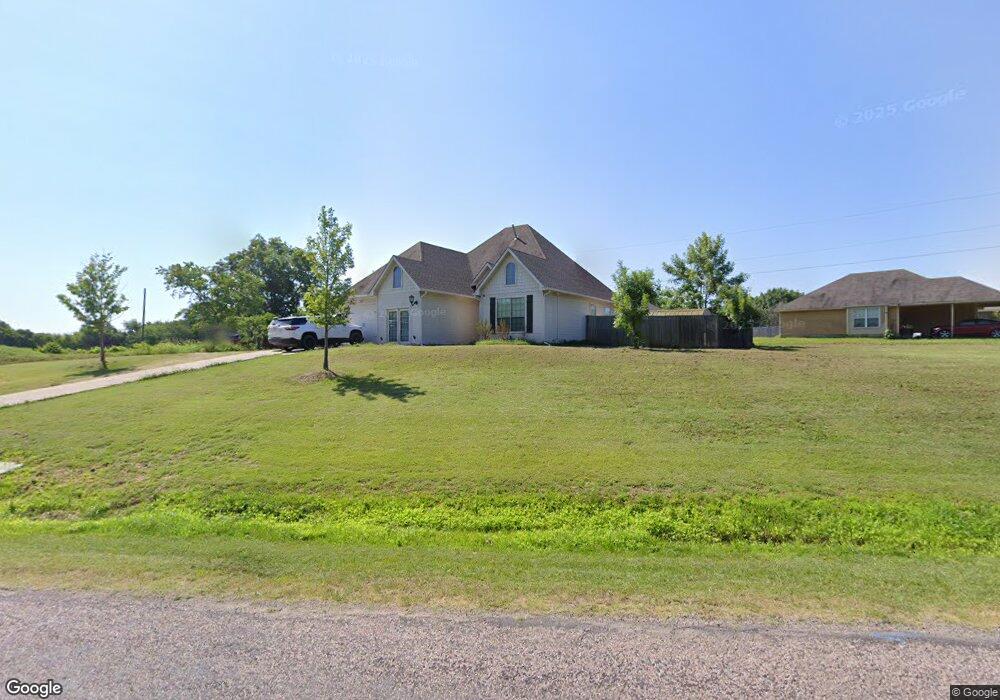
1301 Old Ector Rd Bonham, TX 75418
Estimated Value: $238,000 - $263,000
3
Beds
2
Baths
1,606
Sq Ft
$156/Sq Ft
Est. Value
About This Home
This home is located at 1301 Old Ector Rd, Bonham, TX 75418 and is currently estimated at $250,539, approximately $156 per square foot. 1301 Old Ector Rd is a home located in Fannin County with nearby schools including Evans Elementary School, Finley-Oates Elementary School, and LH Rather Jr High School.
Ownership History
Date
Name
Owned For
Owner Type
Purchase Details
Closed on
Apr 25, 2013
Sold by
Gass Brent and Gass Janetle
Bought by
Underwood Adamson Bradley and Underwood Amanda Denise
Current Estimated Value
Purchase Details
Closed on
Apr 9, 2012
Sold by
Underwood Adamson B and Underwood Amanda Denise
Bought by
Gass Brent and Gass Janette
Home Financials for this Owner
Home Financials are based on the most recent Mortgage that was taken out on this home.
Original Mortgage
$6,500
Interest Rate
3.9%
Mortgage Type
Balloon
Purchase Details
Closed on
Feb 22, 2007
Sold by
Legacy Ridge Estates Ltd
Bought by
Underwood Adamson B and Underwood Amanda
Home Financials for this Owner
Home Financials are based on the most recent Mortgage that was taken out on this home.
Original Mortgage
$205,000
Interest Rate
6.17%
Mortgage Type
Purchase Money Mortgage
Create a Home Valuation Report for This Property
The Home Valuation Report is an in-depth analysis detailing your home's value as well as a comparison with similar homes in the area
Purchase History
| Date | Buyer | Sale Price | Title Company |
|---|---|---|---|
| Underwood Adamson Bradley | -- | None Available | |
| Gass Brent | -- | None Available | |
| Underwood Adamson B | -- | Cole Title Co |
Source: Public Records
Mortgage History
| Date | Status | Borrower | Loan Amount |
|---|---|---|---|
| Previous Owner | Gass Brent | $6,500 | |
| Previous Owner | Gass Brent | $118,400 | |
| Previous Owner | Underwood Adamson B | $205,000 |
Source: Public Records
Tax History
| Year | Tax Paid | Tax Assessment Tax Assessment Total Assessment is a certain percentage of the fair market value that is determined by local assessors to be the total taxable value of land and additions on the property. | Land | Improvement |
|---|---|---|---|---|
| 2025 | $5,592 | $288,290 | $61,060 | $227,230 |
| 2024 | $4,187 | $304,820 | $55,470 | $249,350 |
| 2023 | $6,085 | $308,580 | $48,030 | $260,550 |
| 2022 | $6,123 | $278,410 | $48,030 | $230,380 |
| 2021 | $5,086 | $201,250 | $24,200 | $177,050 |
| 2020 | $4,787 | $187,270 | $13,780 | $173,490 |
| 2019 | $4,623 | $173,960 | $13,780 | $160,180 |
| 2018 | $4,118 | $155,180 | $13,770 | $141,410 |
| 2017 | $3,262 | $127,640 | $13,780 | $113,860 |
| 2016 | $2,978 | $116,510 | $13,780 | $102,730 |
| 2015 | -- | $95,000 | $7,060 | $87,940 |
| 2014 | -- | $116,670 | $7,060 | $109,610 |
Source: Public Records
Map
Nearby Homes
Your Personal Tour Guide
Ask me questions while you tour the home.