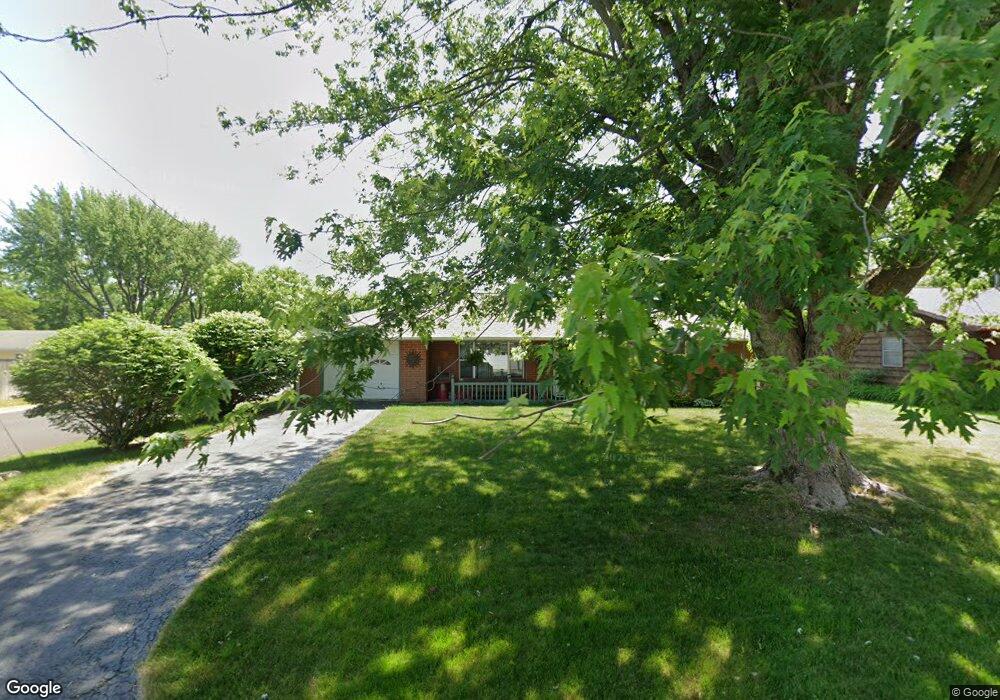
1301 S Clay St Frankfort, IN 46041
Estimated Value: $184,899 - $202,000
3
Beds
1
Bath
1,250
Sq Ft
$155/Sq Ft
Est. Value
About This Home
This home is located at 1301 S Clay St, Frankfort, IN 46041 and is currently estimated at $193,975, approximately $155 per square foot. 1301 S Clay St is a home located in Clinton County with nearby schools including Frankfort Senior High School and Frankfort Covenant Academy.
Ownership History
Date
Name
Owned For
Owner Type
Purchase Details
Closed on
Oct 3, 2014
Sold by
Trent John W and Trent Janet S
Bought by
Avery Stacey J
Current Estimated Value
Home Financials for this Owner
Home Financials are based on the most recent Mortgage that was taken out on this home.
Original Mortgage
$81,632
Outstanding Balance
$62,514
Interest Rate
4.07%
Mortgage Type
New Conventional
Estimated Equity
$131,461
Purchase Details
Closed on
Jun 11, 1998
Sold by
Staley Robert L and Hw Mary M
Bought by
Lashbrook Paul A and Lashbrook Elsie M
Create a Home Valuation Report for This Property
The Home Valuation Report is an in-depth analysis detailing your home's value as well as a comparison with similar homes in the area
Home Values in the Area
Average Home Value in this Area
Purchase History
| Date | Buyer | Sale Price | Title Company |
|---|---|---|---|
| Avery Stacey J | -- | None Available | |
| Lashbrook Paul A | $78,000 | -- |
Source: Public Records
Mortgage History
| Date | Status | Borrower | Loan Amount |
|---|---|---|---|
| Open | Avery Stacey J | $81,632 |
Source: Public Records
Tax History Compared to Growth
Tax History
| Year | Tax Paid | Tax Assessment Tax Assessment Total Assessment is a certain percentage of the fair market value that is determined by local assessors to be the total taxable value of land and additions on the property. | Land | Improvement |
|---|---|---|---|---|
| 2024 | $1,192 | $107,700 | $12,100 | $95,600 |
| 2023 | $1,193 | $107,700 | $12,100 | $95,600 |
| 2022 | $1,200 | $107,700 | $12,100 | $95,600 |
| 2021 | $1,116 | $86,500 | $12,100 | $74,400 |
| 2020 | $1,113 | $86,500 | $12,100 | $74,400 |
| 2019 | $985 | $86,700 | $12,100 | $74,600 |
| 2018 | $980 | $86,700 | $12,100 | $74,600 |
| 2017 | $933 | $84,600 | $11,100 | $73,500 |
| 2016 | $1,016 | $92,400 | $11,100 | $81,300 |
| 2014 | $784 | $91,500 | $11,100 | $80,400 |
Source: Public Records
Map
Nearby Homes
- 401 Knox St
- 608 Ann St
- 353 Brightwood Dr
- 862 S Jackson St
- 901 Harvard Terrace
- 508 Glendale Dr
- 708 Glendale Dr
- 820 Hackberry Ct
- 652 S Jackson St
- 557 E Boone St
- 708 Maple Dr
- 458 S Jackson St
- 1008 Homewood Dr
- 1309 Lea Ct
- 358 S Columbia St
- 1209 E Wabash St
- 1058 E South St
- 840 S Hoke Ave
- 1053 E Wabash St
- 359 S 2nd St