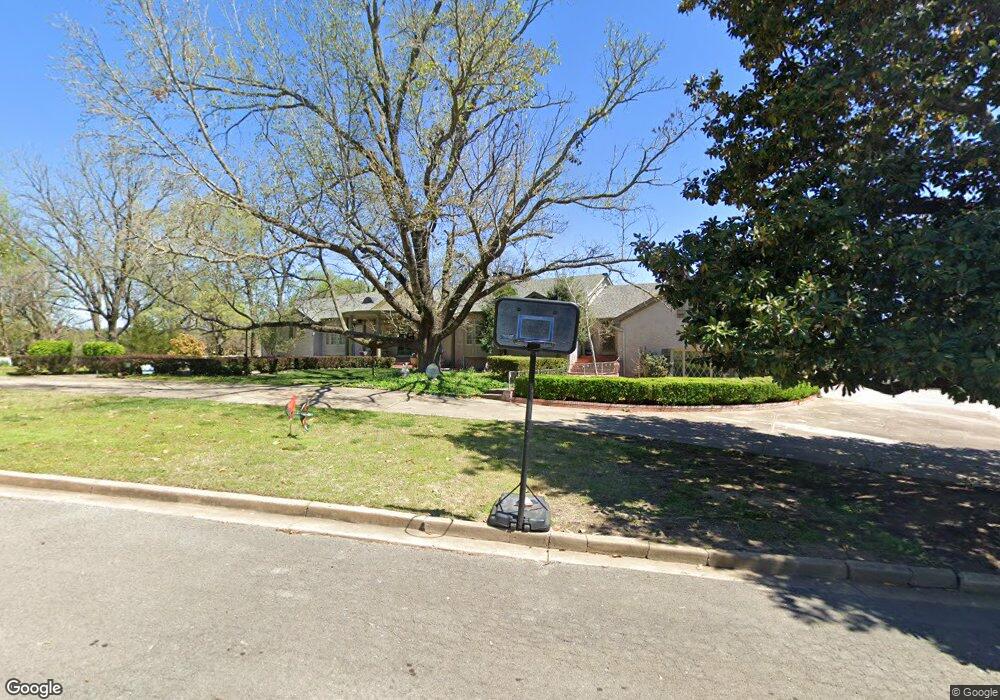
1301 S Ross Ave Tahlequah, OK 74464
Estimated Value: $243,000 - $854,000
4
Beds
6
Baths
7,716
Sq Ft
$81/Sq Ft
Est. Value
About This Home
This home is located at 1301 S Ross Ave, Tahlequah, OK 74464 and is currently estimated at $623,193, approximately $80 per square foot. 1301 S Ross Ave is a home located in Cherokee County with nearby schools including Greenwood Elementary School, Cherokee Elementary School, and Tahlequah Middle School.
Ownership History
Date
Name
Owned For
Owner Type
Purchase Details
Closed on
Aug 18, 2011
Sold by
M & B Investment Corp
Bought by
The J L Hobbs Revocable Trust
Current Estimated Value
Home Financials for this Owner
Home Financials are based on the most recent Mortgage that was taken out on this home.
Original Mortgage
$707,000
Outstanding Balance
$489,597
Interest Rate
4.65%
Mortgage Type
Future Advance Clause Open End Mortgage
Estimated Equity
$133,596
Purchase Details
Closed on
Aug 11, 2011
Sold by
Lobaugh Ronald D and The Lobaugh Family Revocable T
Bought by
The J L Hobbs Revocable Trust
Home Financials for this Owner
Home Financials are based on the most recent Mortgage that was taken out on this home.
Original Mortgage
$707,000
Outstanding Balance
$489,597
Interest Rate
4.65%
Mortgage Type
Future Advance Clause Open End Mortgage
Estimated Equity
$133,596
Create a Home Valuation Report for This Property
The Home Valuation Report is an in-depth analysis detailing your home's value as well as a comparison with similar homes in the area
Home Values in the Area
Average Home Value in this Area
Purchase History
| Date | Buyer | Sale Price | Title Company |
|---|---|---|---|
| The J L Hobbs Revocable Trust | $700,000 | None Available | |
| The J L Hobbs Revocable Trust | -- | None Available |
Source: Public Records
Mortgage History
| Date | Status | Borrower | Loan Amount |
|---|---|---|---|
| Open | The J L Hobbs Revocable Trust | $707,000 |
Source: Public Records
Tax History Compared to Growth
Tax History
| Year | Tax Paid | Tax Assessment Tax Assessment Total Assessment is a certain percentage of the fair market value that is determined by local assessors to be the total taxable value of land and additions on the property. | Land | Improvement |
|---|---|---|---|---|
| 2025 | $5,902 | $65,400 | $5,500 | $59,900 |
| 2024 | $5,902 | $62,286 | $5,500 | $56,786 |
| 2023 | $5,902 | $59,320 | $5,500 | $53,820 |
| 2022 | $5,504 | $59,320 | $5,500 | $53,820 |
| 2021 | $5,524 | $59,320 | $5,500 | $53,820 |
| 2020 | $5,624 | $59,320 | $5,500 | $53,820 |
| 2019 | $5,322 | $56,640 | $5,500 | $51,140 |
| 2018 | $5,128 | $53,943 | $5,500 | $48,443 |
| 2017 | $5,107 | $53,820 | $5,500 | $48,320 |
| 2016 | $4,894 | $51,258 | $5,500 | $45,758 |
| 2015 | $5,845 | $48,817 | $5,500 | $43,317 |
| 2014 | $5,845 | $62,090 | $4,840 | $57,250 |
Source: Public Records
Map
Nearby Homes
- 1104 Chase Ave
- 1500 Stickross Mountain Rd
- 509 W 2nd St
- 905 Shelley Cir
- 1700 Stickross Mountain Rd
- 902 S Mission Ave
- 821 S College Ave
- 802 S College Ave
- 1025 W Fox St
- 516 W Fox St
- 513 S State Ave
- 757 S Bluff Ave
- Tbd Unit West Fox Street Tahl
- 2920 Mountain
- 528 S Muskogee Ave
- 510 S Cherokee Ave
- 670 Ridgeview Dr
- 306 Short St
- 14351 U S Highway 62
- 16133 U S Highway 62
- 1301 S Ross Ave
- 1301 S Ross Ave
- 1301 W Ross Ave
- 1395 Stick Ross Mountain Rd
- 1403 Stick Ross Mountain Rd
- 1208 Ross Place
- 1207 Ross Place
- 1207 Ross Place
- 1206 Ross Place
- 1284 Garner Ave
- 1205 Ross Place
- 1308 Stick Ross Mountain Rd
- 1210 S Ross Ave
- 1211 Garner Ave
- 1210 W Ross Ave
- 1210 Garner Ave
- 1213 W Ross Ave
- 1306 Stick Ross Mountain Rd
- 1314 Stick Ross Mountain Rd
- 1314 Stick Ross Mountain Rd