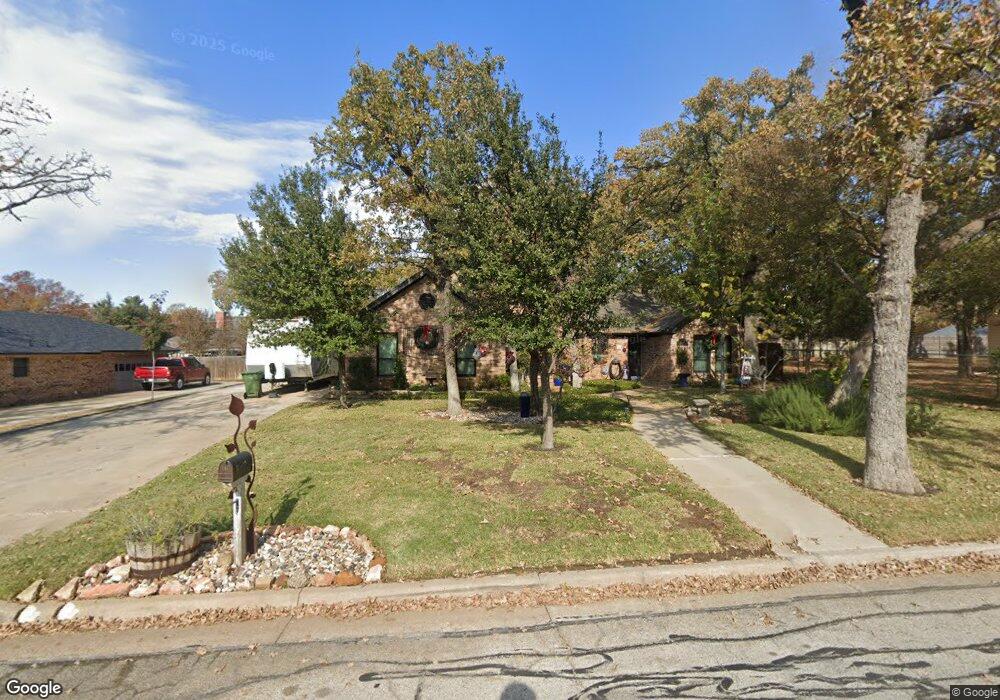
1301 Shirley Way Bedford, TX 76022
Estimated Value: $385,757 - $442,000
3
Beds
2
Baths
1,950
Sq Ft
$209/Sq Ft
Est. Value
About This Home
This home is located at 1301 Shirley Way, Bedford, TX 76022 and is currently estimated at $407,439, approximately $208 per square foot. 1301 Shirley Way is a home located in Tarrant County with nearby schools including Stonegate Elementary School, Central J High School, and L.D. Bell High School.
Ownership History
Date
Name
Owned For
Owner Type
Purchase Details
Closed on
Apr 18, 2007
Sold by
Steerman Hilderbrand Patricia M and Steerman Patricia M
Bought by
Hilderbrand Mark S
Current Estimated Value
Home Financials for this Owner
Home Financials are based on the most recent Mortgage that was taken out on this home.
Original Mortgage
$140,000
Interest Rate
6.1%
Mortgage Type
Credit Line Revolving
Purchase Details
Closed on
Jul 14, 2000
Sold by
Boen Carol and Boen Carol June
Bought by
Steerman Patricia M
Home Financials for this Owner
Home Financials are based on the most recent Mortgage that was taken out on this home.
Original Mortgage
$75,000
Interest Rate
8.36%
Purchase Details
Closed on
Sep 15, 1995
Sold by
Boen Kenneth Wayne
Bought by
Boen Carol June
Create a Home Valuation Report for This Property
The Home Valuation Report is an in-depth analysis detailing your home's value as well as a comparison with similar homes in the area
Home Values in the Area
Average Home Value in this Area
Purchase History
| Date | Buyer | Sale Price | Title Company |
|---|---|---|---|
| Hilderbrand Mark S | -- | American Title | |
| Steerman Patricia M | -- | Safeco Land Title | |
| Boen Carol June | -- | -- |
Source: Public Records
Mortgage History
| Date | Status | Borrower | Loan Amount |
|---|---|---|---|
| Closed | Hilderbrand Mark S | $140,000 | |
| Previous Owner | Steerman Patricia M | $75,000 |
Source: Public Records
Tax History Compared to Growth
Tax History
| Year | Tax Paid | Tax Assessment Tax Assessment Total Assessment is a certain percentage of the fair market value that is determined by local assessors to be the total taxable value of land and additions on the property. | Land | Improvement |
|---|---|---|---|---|
| 2025 | $3,143 | $358,313 | $75,000 | $283,313 |
| 2024 | $3,143 | $358,313 | $75,000 | $283,313 |
| 2023 | $6,841 | $373,096 | $55,000 | $318,096 |
| 2022 | $7,082 | $330,539 | $55,000 | $275,539 |
| 2021 | $6,944 | $306,884 | $55,000 | $251,884 |
| 2020 | $6,372 | $267,987 | $55,000 | $212,987 |
| 2019 | $6,519 | $269,559 | $55,000 | $214,559 |
| 2018 | $5,544 | $243,947 | $35,000 | $208,947 |
| 2017 | $5,993 | $249,737 | $35,000 | $214,737 |
| 2016 | $5,017 | $208,270 | $35,000 | $173,270 |
| 2015 | $4,029 | $194,398 | $35,000 | $159,398 |
| 2014 | $4,029 | $171,400 | $28,000 | $143,400 |
Source: Public Records
Map
Nearby Homes
- 1213 Briar Dr
- 1509 Shirley Way
- 1204 Edgecliff Dr
- 1416 Wade Dr
- 604 Donna Ln
- 1004 Overhill Dr
- 1108 Wade Dr
- 921 Overhill Dr
- 1031 Boston Blvd
- 345 Somerset Cir
- 49 Coffee Tavern Rd
- 1701 Winchester Way
- 501 Merrill Dr
- 909 Overhill Dr
- 258 Somerset Terrace
- 6 Park Ln
- 18 Park Ln
- 1236 King Dr
- 933 Wade Dr
- 140 Stonegate Ct
- 1225 Shirley Way
- 1324 Circle Ln
- 1305 Shirley Way
- 1328 Circle Ln
- 1320 Circle Ln
- 1304 Shirley Way
- 1300 Shirley Way
- 1221 Shirley Way
- 1308 Shirley Way
- 1220 Shirley Way
- 1400 Circle Ln
- 1316 Circle Ln
- 1313 Shirley Way
- 1312 Shirley Way
- 1216 Shirley Way
- 1217 Shirley Way
- 1317 Circle Ln
- 1321 Circle Ln
- 1305 Briar Dr
- 1301 Briar Dr