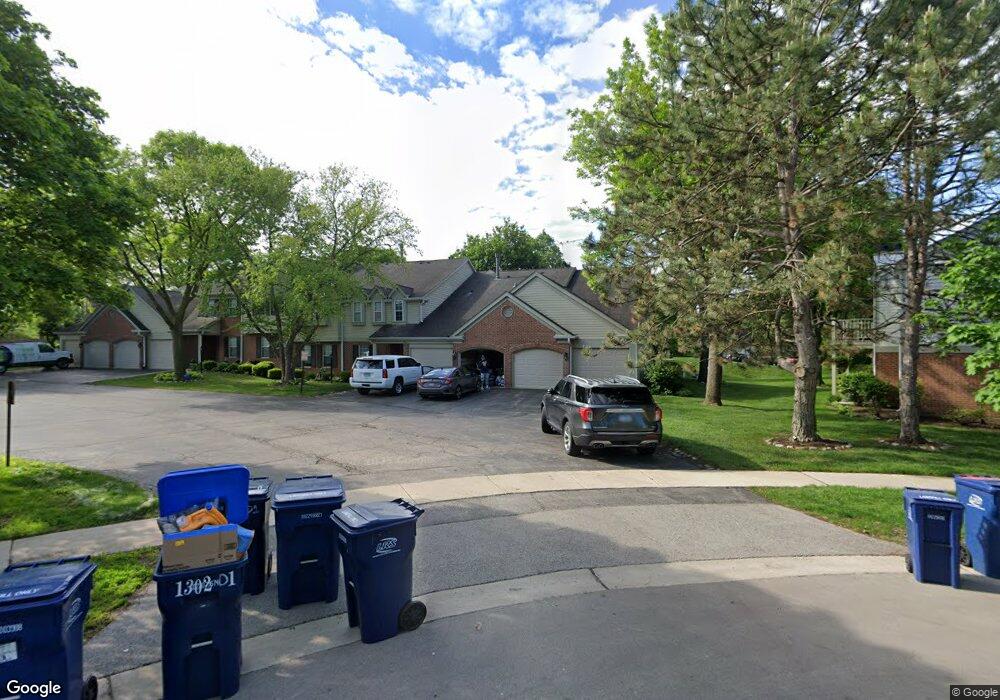
1301 Timberwood Ct Unit 58RC Schaumburg, IL 60193
East Schaumburg NeighborhoodEstimated Value: $276,000 - $298,000
3
Beds
--
Bath
1,500
Sq Ft
$194/Sq Ft
Est. Value
About This Home
This home is located at 1301 Timberwood Ct Unit 58RC, Schaumburg, IL 60193 and is currently estimated at $291,332, approximately $194 per square foot. 1301 Timberwood Ct Unit 58RC is a home located in Cook County with nearby schools including Michael Collins Elementary School, Margaret Mead Junior High School, and J B Conant High School.
Ownership History
Date
Name
Owned For
Owner Type
Purchase Details
Closed on
Apr 8, 2004
Sold by
Carlotta Giovanna
Bought by
Carlotta Carlo J
Current Estimated Value
Purchase Details
Closed on
Aug 15, 2002
Sold by
Freeman Ronald E and Freeman Patricia A
Bought by
Carlotta Carlo J
Home Financials for this Owner
Home Financials are based on the most recent Mortgage that was taken out on this home.
Original Mortgage
$131,200
Outstanding Balance
$50,813
Interest Rate
5.37%
Estimated Equity
$240,519
Purchase Details
Closed on
Jan 3, 1994
Sold by
First Bank Of Schaumburg
Bought by
Freeman Ronald E and Freeman Patricia A
Home Financials for this Owner
Home Financials are based on the most recent Mortgage that was taken out on this home.
Original Mortgage
$85,000
Interest Rate
7.17%
Create a Home Valuation Report for This Property
The Home Valuation Report is an in-depth analysis detailing your home's value as well as a comparison with similar homes in the area
Home Values in the Area
Average Home Value in this Area
Purchase History
| Date | Buyer | Sale Price | Title Company |
|---|---|---|---|
| Carlotta Carlo J | -- | -- | |
| Carlotta Carlo J | $164,000 | Lawyers Title Insurance Corp | |
| Freeman Ronald E | $79,000 | -- |
Source: Public Records
Mortgage History
| Date | Status | Borrower | Loan Amount |
|---|---|---|---|
| Open | Carlotta Carlo J | $131,200 | |
| Previous Owner | Freeman Ronald E | $85,000 | |
| Closed | Carlotta Carlo J | $16,400 |
Source: Public Records
Tax History Compared to Growth
Tax History
| Year | Tax Paid | Tax Assessment Tax Assessment Total Assessment is a certain percentage of the fair market value that is determined by local assessors to be the total taxable value of land and additions on the property. | Land | Improvement |
|---|---|---|---|---|
| 2024 | $4,780 | $20,380 | $3,940 | $16,440 |
| 2023 | $4,607 | $20,380 | $3,940 | $16,440 |
| 2022 | $4,607 | $20,380 | $3,940 | $16,440 |
| 2021 | $3,571 | $15,113 | $5,048 | $10,065 |
| 2020 | $3,578 | $15,113 | $5,048 | $10,065 |
| 2019 | $3,584 | $16,801 | $5,048 | $11,753 |
| 2018 | $2,362 | $11,305 | $4,247 | $7,058 |
| 2017 | $2,342 | $11,305 | $4,247 | $7,058 |
| 2016 | $2,433 | $11,305 | $4,247 | $7,058 |
| 2015 | $2,031 | $9,411 | $3,693 | $5,718 |
| 2014 | $2,025 | $9,411 | $3,693 | $5,718 |
| 2013 | $1,955 | $9,411 | $3,693 | $5,718 |
Source: Public Records
Map
Nearby Homes
- 1301 Timberwood Ct Unit D1
- 151 Brookston Dr Unit A2
- 1257 Rosewood Ct Unit D1
- 1300 Woodside Ct Unit B1
- 26 Egg Harbour Ct
- 274 Buckingham Ct Unit D2
- 1264 Williamsburg Dr Unit D2
- 15 Bar Harbour Rd Unit 4F
- 1254 Plum Tree Ct Unit A2
- 327 Wildberry Ct Unit D2
- 263 Driftwood Ln Unit 2D
- 391 Thornhill Ct Unit B1
- 1386 Scarboro Rd Unit 1102
- 373 Southbury Ct Unit D-1
- 1385 Scarboro Rd Unit 204
- 243 Spring Creek Cir Unit 462
- 1527 Lexington Cir
- 307 University Ln Unit A
- 251 University Ln
- 1871 Fox Run Dr Unit A
- 1301 Timberwood Ct Unit 58RD
- 1301 Timberwood Ct Unit 58RC
- 1301 Timberwood Ct Unit 58RD
- 1301 Timberwood Ct Unit C1
- 1303 Timberwood Ct Unit 58LB
- 1303 Timberwood Ct Unit 58LB
- 1303 Timberwood Ct Unit 58LA
- 1303 Timberwood Ct Unit 58LA
- 1303 Timberwood Ct Unit B2
- 1303 Timberwood Ct Unit A1
- 1303 Timberwood Ct Unit B1
- 1300 Timberwood Ct Unit 47LA
- 1300 Timberwood Ct Unit 47LA
- 1300 Timberwood Ct Unit 47LB
- 1300 Timberwood Ct Unit 47LB
- 1300 Timberwood Ct Unit A1
- 1300 Timberwood Ct Unit 2A
- 1300 Timberwood Ct Unit B1
- 1308 Springwood Dr Unit 610R
- 1308 Springwood Dr Unit 610R