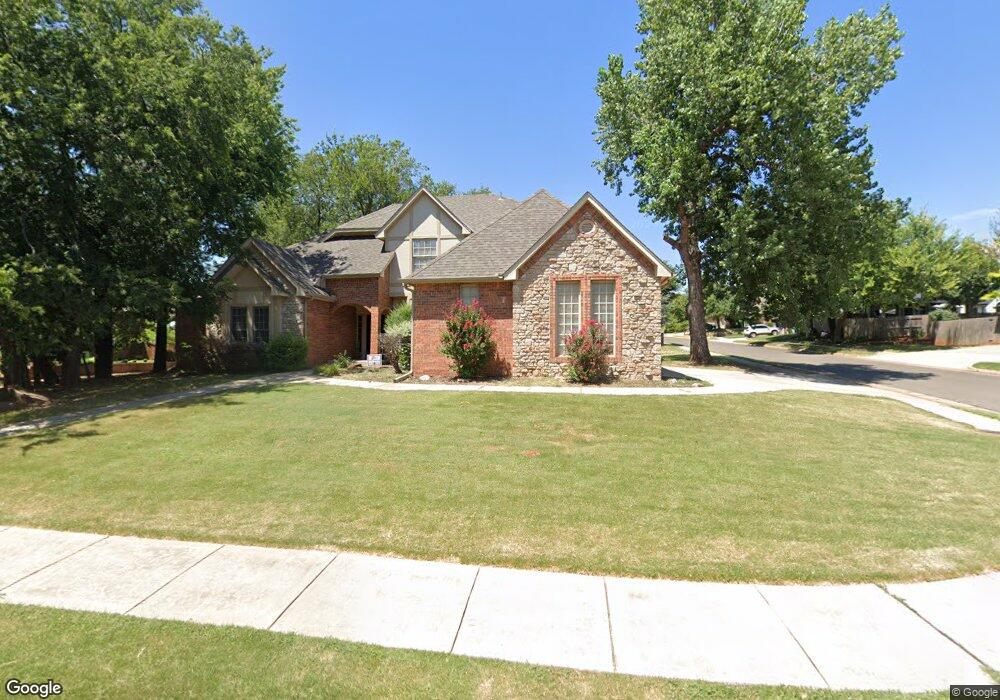
1301 Wild Plum Ct Edmond, OK 73025
Coffee Creek NeighborhoodEstimated Value: $499,000 - $553,000
4
Beds
4
Baths
3,213
Sq Ft
$161/Sq Ft
Est. Value
About This Home
This home is located at 1301 Wild Plum Ct, Edmond, OK 73025 and is currently estimated at $517,517, approximately $161 per square foot. 1301 Wild Plum Ct is a home located in Oklahoma County with nearby schools including Cross Timbers Elementary School, Cheyenne Middle School, and North High School.
Ownership History
Date
Name
Owned For
Owner Type
Purchase Details
Closed on
Apr 22, 2016
Sold by
Simon Louis S and Simon Amy M
Bought by
Crutison Allahim
Current Estimated Value
Purchase Details
Closed on
Apr 28, 2009
Sold by
Cartus Financial Corporation
Bought by
Simon Louis S and Simon Amy M
Home Financials for this Owner
Home Financials are based on the most recent Mortgage that was taken out on this home.
Original Mortgage
$232,000
Interest Rate
4.72%
Mortgage Type
Purchase Money Mortgage
Purchase Details
Closed on
Oct 29, 2008
Sold by
Kalisiak Louis T and Kalisiak Karen
Bought by
Cartus Financial Corporation
Purchase Details
Closed on
Aug 3, 2001
Sold by
Fred Forde Homes Inc
Bought by
Kalisiak Louis T
Purchase Details
Closed on
Oct 10, 2000
Sold by
Oak Tree Park Development Llc
Bought by
Fred Forde Homes Inc
Create a Home Valuation Report for This Property
The Home Valuation Report is an in-depth analysis detailing your home's value as well as a comparison with similar homes in the area
Home Values in the Area
Average Home Value in this Area
Purchase History
| Date | Buyer | Sale Price | Title Company |
|---|---|---|---|
| Crutison Allahim | $251,500 | Old Republic Title | |
| Simon Louis S | $290,000 | Oklahoma Title & Closing Co | |
| Cartus Financial Corporation | $337,500 | Multiple | |
| Kalisiak Louis T | $302,000 | Capitol Abstract & Title Co | |
| Fred Forde Homes Inc | -- | Capitol Abstract & Title Co |
Source: Public Records
Mortgage History
| Date | Status | Borrower | Loan Amount |
|---|---|---|---|
| Previous Owner | Simon Louis S | $232,000 |
Source: Public Records
Tax History Compared to Growth
Tax History
| Year | Tax Paid | Tax Assessment Tax Assessment Total Assessment is a certain percentage of the fair market value that is determined by local assessors to be the total taxable value of land and additions on the property. | Land | Improvement |
|---|---|---|---|---|
| 2024 | $4,772 | $48,070 | $7,053 | $41,017 |
| 2023 | $4,772 | $45,781 | $7,022 | $38,759 |
| 2022 | $4,562 | $43,601 | $7,901 | $35,700 |
| 2021 | $4,325 | $41,525 | $8,182 | $33,343 |
| 2020 | $4,226 | $40,095 | $8,103 | $31,992 |
| 2019 | $4,147 | $39,160 | $8,103 | $31,057 |
| 2018 | $4,184 | $39,270 | $0 | $0 |
| 2017 | $4,217 | $39,764 | $8,103 | $31,661 |
| 2016 | $4,162 | $39,324 | $6,759 | $32,565 |
| 2015 | $4,069 | $38,493 | $6,759 | $31,734 |
| 2014 | $3,957 | $37,482 | $6,759 | $30,723 |
Source: Public Records
Map
Nearby Homes
- 1205 Copper Rock Dr
- 4204 Wild Plum Ln
- 4616 Briar Meade Rd
- 4224 Abbey Park Dr
- D Plan at The Abbey at Coffee Creek
- C Plan at The Abbey at Coffee Creek
- B Plan at The Abbey at Coffee Creek
- A Plan at The Abbey at Coffee Creek
- Duplex Plan at The Abbey at Coffee Creek
- 917 Wb Meyer Pkwy
- 1065 Villas Creek Dr
- 824 Winning Colors Dr
- 1034 Villas Creek Dr
- 1701 Woodhill Rd
- 1704 Woodhill Rd
- 4109 Riva Ridge Ct
- 1669 Saratoga Way
- 1665 Saratoga Way
- 740 Northern Dancer Dr
- 733 Real Quiet Cir
- 1305 Wild Plum Ct
- 1300 Twin Grove Courts
- 1304 Twin Grove Ct
- 1304 Twin Grove Courts
- 1213 Wild Plum Ct
- 1309 Wild Plum Ct
- 1212 Twin Grove Courts
- 1212 Wild Plum Ct
- 1308 Twin Grove Courts
- 1209 Wild Plum Ct
- 1208 Twin Grove Courts
- 1208 Wild Plum Ct
- 1301 Copper Rock Dr
- 1313 Wild Plum Ct
- 1305 Copper Rock Dr
- 1301 Twin Grove Courts
- 1301 Twin Grove Ct
- 1312 Twin Grove Courts
- 1312 Wild Plum Ct
- 1305 Twin Grove Courts