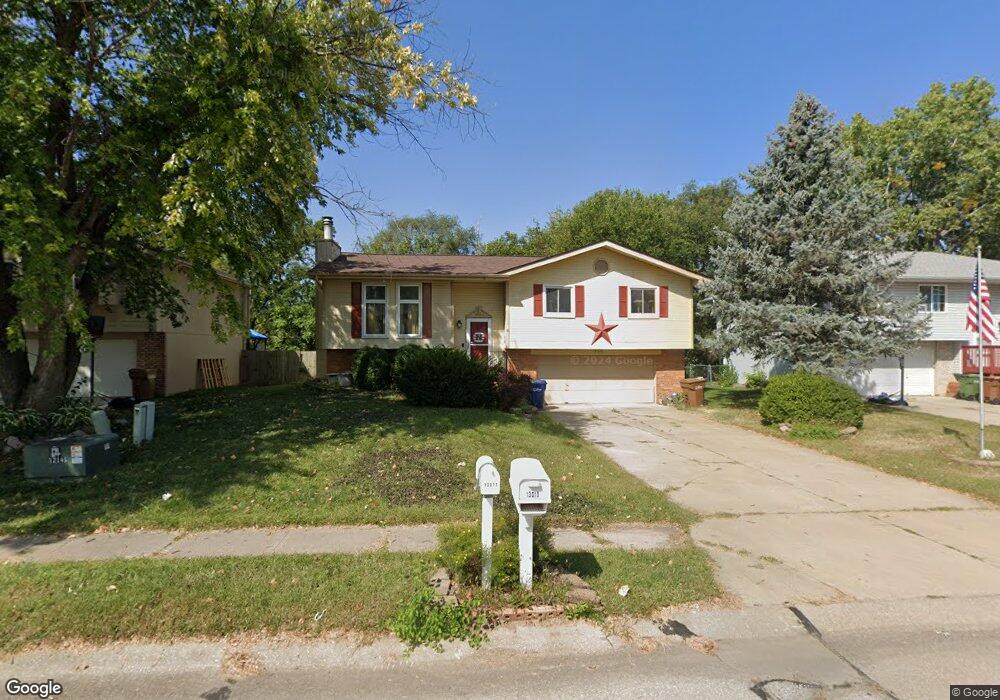
13010 S 24th St Bellevue, NE 68123
Estimated Value: $258,000 - $280,000
3
Beds
4
Baths
1,588
Sq Ft
$171/Sq Ft
Est. Value
About This Home
This home is located at 13010 S 24th St, Bellevue, NE 68123 and is currently estimated at $271,600, approximately $171 per square foot. 13010 S 24th St is a home located in Sarpy County with nearby schools including Fort Crook Elementary School, Bellevue Mission Middle School, and Bellevue West High School.
Ownership History
Date
Name
Owned For
Owner Type
Purchase Details
Closed on
Aug 6, 2007
Sold by
Ottman Rochelle
Bought by
Jolley Christopher and Jolley Jennifer
Current Estimated Value
Home Financials for this Owner
Home Financials are based on the most recent Mortgage that was taken out on this home.
Original Mortgage
$148,100
Outstanding Balance
$93,913
Interest Rate
6.69%
Mortgage Type
VA
Estimated Equity
$177,687
Purchase Details
Closed on
Sep 10, 2004
Sold by
Brandt Michele R
Bought by
Ottman Rochelle
Home Financials for this Owner
Home Financials are based on the most recent Mortgage that was taken out on this home.
Original Mortgage
$131,900
Interest Rate
5.95%
Mortgage Type
VA
Purchase Details
Closed on
Apr 17, 2002
Sold by
Brandt Richard E
Bought by
Brandt Michele R
Create a Home Valuation Report for This Property
The Home Valuation Report is an in-depth analysis detailing your home's value as well as a comparison with similar homes in the area
Home Values in the Area
Average Home Value in this Area
Purchase History
| Date | Buyer | Sale Price | Title Company |
|---|---|---|---|
| Jolley Christopher | $145,000 | Rels | |
| Ottman Rochelle | $128,000 | Midwest Land Title | |
| Brandt Michele R | -- | -- |
Source: Public Records
Mortgage History
| Date | Status | Borrower | Loan Amount |
|---|---|---|---|
| Open | Jolley Christopher | $148,100 | |
| Closed | Ottman Rochelle | $131,900 |
Source: Public Records
Tax History Compared to Growth
Tax History
| Year | Tax Paid | Tax Assessment Tax Assessment Total Assessment is a certain percentage of the fair market value that is determined by local assessors to be the total taxable value of land and additions on the property. | Land | Improvement |
|---|---|---|---|---|
| 2025 | $3,589 | $226,836 | $42,000 | $184,836 |
| 2024 | $4,114 | $206,611 | $36,000 | $170,611 |
| 2023 | $4,114 | $194,813 | $33,000 | $161,813 |
| 2022 | $3,646 | $169,436 | $28,000 | $141,436 |
| 2021 | $3,417 | $157,073 | $28,000 | $129,073 |
| 2020 | $3,324 | $152,311 | $24,000 | $128,311 |
| 2019 | $3,062 | $141,199 | $24,000 | $117,199 |
| 2018 | $2,897 | $137,178 | $20,000 | $117,178 |
| 2017 | $2,792 | $131,322 | $20,000 | $111,322 |
| 2016 | $2,655 | $127,606 | $20,000 | $107,606 |
| 2015 | $2,582 | $124,854 | $20,000 | $104,854 |
| 2014 | $2,486 | $119,423 | $20,000 | $99,423 |
| 2012 | -- | $122,329 | $20,000 | $102,329 |
Source: Public Records
Map
Nearby Homes
- 2512 Nottingham Dr
- 13211 S 26th Ave
- 12722 S 28th Ave
- 12901 S 29th Place
- 13403 S 28th St
- 2940 Leawood Dr
- 2923 Blackhawk Dr
- 3105 Mirror Cir
- 3102 Redwing Dr
- 3105 Leawood Dr
- 2939 Lone Tree Rd
- 0000 Cedar Island Road East of Old 36th St
- 2810 Bar Harbor Dr
- 14002 Tregaron Ridge Ave Unit B
- 1506 Halifax St
- 13908 S 17th St
- 14112 S 22nd St
- 3309 Lookingglass Dr
- 14107 S 18th St
- 3506 Lynnwood Dr
- 13012 S 24th St
- 13012 24th Bellevue St
- 13014 S 24th St
- 13006 S 24th St
- 13011 S 24th St
- 2306 Derby Dr
- 13009 S 24th St
- 13102 S 24th St
- 13007 S 24th St
- S S 24th St
- 2304 Derby Dr
- 13104 S 24th St
- 2210 Derby Dr
- 13103 S 24th St
- 13005 S 24th Cir
- 13005 S 24th Cir
- 2208 Derby Dr
- 13106 S 24th St
- 13105 S 24th St
- 2301 Derby Dr