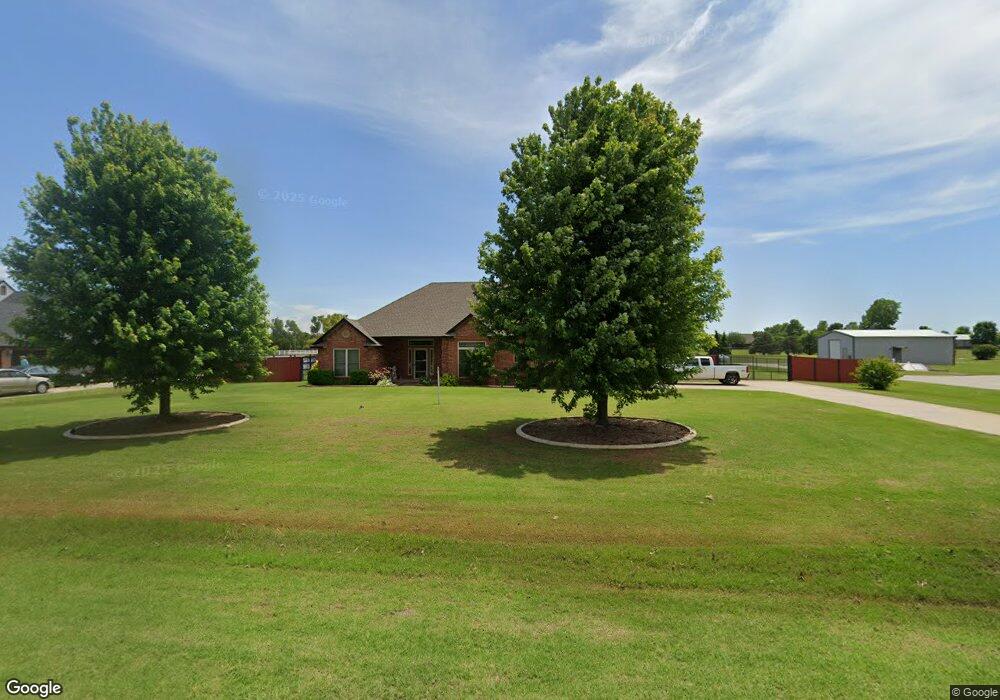
13012 SW 47th St Mustang, OK 73064
Estimated Value: $377,179 - $446,000
3
Beds
2
Baths
2,082
Sq Ft
$201/Sq Ft
Est. Value
About This Home
This home is located at 13012 SW 47th St, Mustang, OK 73064 and is currently estimated at $419,045, approximately $201 per square foot. 13012 SW 47th St is a home located in Canadian County with nearby schools including Mustang Lakehoma Elementary School, Mustang Horizon Intermediate School, and Mustang Middle School.
Ownership History
Date
Name
Owned For
Owner Type
Purchase Details
Closed on
Jan 15, 2013
Sold by
Tidaback Russell W and Tidaback Kristen D
Bought by
Stephens Daryle A and Stephens Audrey M
Current Estimated Value
Home Financials for this Owner
Home Financials are based on the most recent Mortgage that was taken out on this home.
Original Mortgage
$223,250
Outstanding Balance
$42,463
Interest Rate
3.34%
Mortgage Type
New Conventional
Estimated Equity
$376,582
Purchase Details
Closed on
Sep 25, 2000
Sold by
Lemaster Victor
Purchase Details
Closed on
May 5, 1999
Sold by
Gary Owens Carpet & Const Inc
Purchase Details
Closed on
Aug 14, 1997
Sold by
Owens Gary and Owens Terri
Purchase Details
Closed on
Jul 3, 1997
Sold by
Gary Owens Carpet & Const Inc
Purchase Details
Closed on
Jul 27, 1995
Sold by
Owens Gary and Owens Terri
Create a Home Valuation Report for This Property
The Home Valuation Report is an in-depth analysis detailing your home's value as well as a comparison with similar homes in the area
Home Values in the Area
Average Home Value in this Area
Purchase History
| Date | Buyer | Sale Price | Title Company |
|---|---|---|---|
| Stephens Daryle A | $235,000 | Ort | |
| -- | $150,000 | -- | |
| -- | $145,000 | -- | |
| -- | -- | -- | |
| -- | -- | -- | |
| -- | -- | -- |
Source: Public Records
Mortgage History
| Date | Status | Borrower | Loan Amount |
|---|---|---|---|
| Open | Stephens Daryle A | $223,250 |
Source: Public Records
Tax History Compared to Growth
Tax History
| Year | Tax Paid | Tax Assessment Tax Assessment Total Assessment is a certain percentage of the fair market value that is determined by local assessors to be the total taxable value of land and additions on the property. | Land | Improvement |
|---|---|---|---|---|
| 2024 | $2,907 | $26,670 | $2,757 | $23,913 |
| 2023 | $2,907 | $26,670 | $2,847 | $23,823 |
| 2022 | $2,950 | $26,669 | $3,480 | $23,189 |
| 2021 | $2,939 | $26,669 | $4,030 | $22,639 |
| 2020 | $2,970 | $26,670 | $2,524 | $24,146 |
| 2019 | $2,967 | $26,670 | $2,500 | $24,170 |
| 2018 | $3,021 | $26,669 | $2,645 | $24,024 |
| 2017 | $2,947 | $26,362 | $2,644 | $23,718 |
| 2016 | $2,850 | $26,362 | $2,644 | $23,718 |
| 2015 | $2,700 | $24,849 | $2,644 | $22,205 |
| 2014 | $2,700 | $24,126 | $2,644 | $21,482 |
Source: Public Records
Map
Nearby Homes
- 13132 SW 44th St
- 4901 Horizon Blvd
- 5409 Heidelberg Dr
- 0 SW 44th St
- 3900 S Cemetery Rd
- 0 SW 59th St
- 0 Regan Rd
- 1400 Quail Lake Way
- 1012 N Scouts Court Way
- 5108 Mccann Ct
- 1305 N Hunters Bridge Way
- 12640 SW 31st St
- 4813 Hambletonian Ln
- 12520 SW 31st St
- 4813 Hidalgo Ave
- 4821 Hidalgo Ave
- 4605 Hidalgo Ave
- 4601 Hidalgo Ave
- 12125 SW 45th Terrace
- 1721 W Antler Way
- 13000 SW 47th St
- 13024 SW 47th St
- 13013 SW 47th St
- 13001 SW 47th St
- 13100 SW 47th St
- 13025 SW 47th St
- 13112 SW 47th St
- 13101 SW 47th St
- 4800 S Cemetery Rd
- 4502 S Cemetery Rd
- 13113 SW 47th St
- 13113 SW 47 St
- 4901 Polo Ln
- 13013 SW 51st St
- 13001 SW 51st St
- 13025 SW 51st St
- 13125 SW 47th St
- 4801 Polo Ln
- 13101 SW 51st St
- 4913 Polo Ln