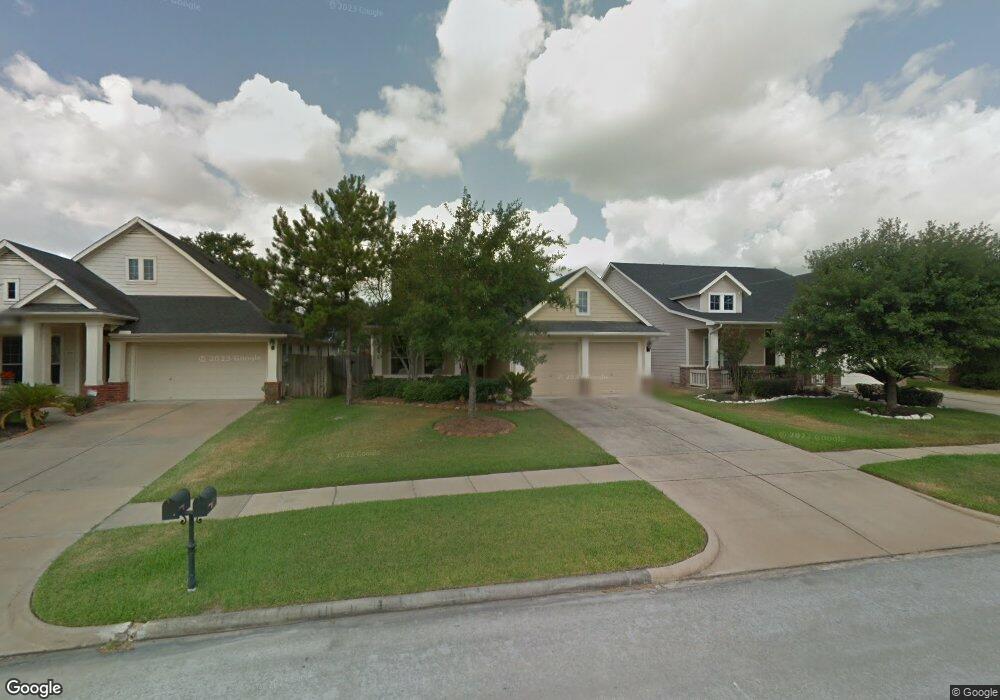
13015 Yorkmont Dr Cypress, TX 77429
Estimated Value: $313,695 - $334,000
3
Beds
2
Baths
1,667
Sq Ft
$195/Sq Ft
Est. Value
About This Home
This home is located at 13015 Yorkmont Dr, Cypress, TX 77429 and is currently estimated at $324,924, approximately $194 per square foot. 13015 Yorkmont Dr is a home located in Harris County with nearby schools including Sampson Elementary School, Spillane Middle School, and Cypress Woods High School.
Ownership History
Date
Name
Owned For
Owner Type
Purchase Details
Closed on
Dec 27, 2016
Sold by
Patterson Carl and Patterson April
Bought by
Orosco Megan M
Current Estimated Value
Home Financials for this Owner
Home Financials are based on the most recent Mortgage that was taken out on this home.
Original Mortgage
$196,224
Outstanding Balance
$161,706
Interest Rate
4.12%
Mortgage Type
FHA
Estimated Equity
$163,218
Purchase Details
Closed on
May 15, 2013
Sold by
Cardenas Paul and Cardenas Maria J
Bought by
Patterson Carl and Patterson April
Home Financials for this Owner
Home Financials are based on the most recent Mortgage that was taken out on this home.
Original Mortgage
$161,100
Interest Rate
3.43%
Mortgage Type
New Conventional
Purchase Details
Closed on
Dec 13, 2002
Sold by
Weekley Homes Lp
Bought by
Cardenas Paul and Cardenas Maria J
Home Financials for this Owner
Home Financials are based on the most recent Mortgage that was taken out on this home.
Original Mortgage
$160,000
Interest Rate
6.05%
Create a Home Valuation Report for This Property
The Home Valuation Report is an in-depth analysis detailing your home's value as well as a comparison with similar homes in the area
Home Values in the Area
Average Home Value in this Area
Purchase History
| Date | Buyer | Sale Price | Title Company |
|---|---|---|---|
| Orosco Megan M | -- | Chicago Title | |
| Patterson Carl | -- | First American Title | |
| Cardenas Paul | -- | Priority Title Company |
Source: Public Records
Mortgage History
| Date | Status | Borrower | Loan Amount |
|---|---|---|---|
| Open | Orosco Megan M | $196,224 | |
| Previous Owner | Patterson Carl | $161,100 | |
| Previous Owner | Cardenas Paul | $160,000 |
Source: Public Records
Tax History Compared to Growth
Tax History
| Year | Tax Paid | Tax Assessment Tax Assessment Total Assessment is a certain percentage of the fair market value that is determined by local assessors to be the total taxable value of land and additions on the property. | Land | Improvement |
|---|---|---|---|---|
| 2025 | $4,271 | $293,100 | $64,800 | $228,300 |
| 2024 | $4,271 | $304,577 | $64,800 | $239,777 |
| 2023 | $4,271 | $304,738 | $64,800 | $239,938 |
| 2022 | $5,770 | $272,672 | $48,000 | $224,672 |
| 2021 | $5,571 | $220,124 | $48,000 | $172,124 |
| 2020 | $5,291 | $202,774 | $38,400 | $164,374 |
| 2019 | $5,338 | $198,377 | $38,400 | $159,977 |
| 2018 | $1,925 | $198,377 | $38,400 | $159,977 |
| 2017 | $5,339 | $198,377 | $38,400 | $159,977 |
| 2016 | $5,339 | $198,377 | $38,400 | $159,977 |
| 2015 | $3,765 | $188,442 | $38,400 | $150,042 |
| 2014 | $3,765 | $172,522 | $38,400 | $134,122 |
Source: Public Records
Map
Nearby Homes
- 13014 Vivienne Westmoreland Dr
- 15803 Stiller Park Dr
- 13718 Sherburn Manor Dr
- 13611 Monteigne Ln
- 14210 Prospect Point Dr
- 14103 Sherburn Manor Dr
- 14314 Prosper Ridge Dr
- 16306 Bontura St
- 15923 Hurstfield Pointe Dr
- 16219 Haden Crest Ct
- 16322 Bontura St
- 13402 Layton Castle Ln
- 13703 Layton Hills Dr
- 16406 Haden Crest Ct
- 16211 Halpren Falls Ln
- 14442 Gleaming Rose Dr
- 12603 Telge Rd Unit 30C-D
- 12603 Telge Rd Unit 26 E-F
- 12603 Telge Rd Unit 8 I-L
- 13835 Jarvis Rd
- 13019 Yorkmont Dr
- 13011 Yorkmont Dr
- 13011 Yorkmont Dr Unit btsa
- 13023 Yorkmont Dr
- 13007 Yorkmont Dr
- 13014 Norstrom Falls Ct
- 13010 Norstrom Falls Ct
- 13018 Norstrom Falls Ct
- 13018 Norstrum Falls Ct
- 13006 Norstrom Falls Ct
- 13027 Yorkmont Dr
- 13003 Yorkmont Dr
- 13022 Norstrom Falls Ct
- 13002 Norstrom Falls Ct
- 13014 Yorkmont Dr
- 13018 Yorkmont Dr
- 13010 Yorkmont Dr
- 13103 Yorkmont Dr
- 13026 Norstrom Falls Ct
- 13022 Yorkmont Dr