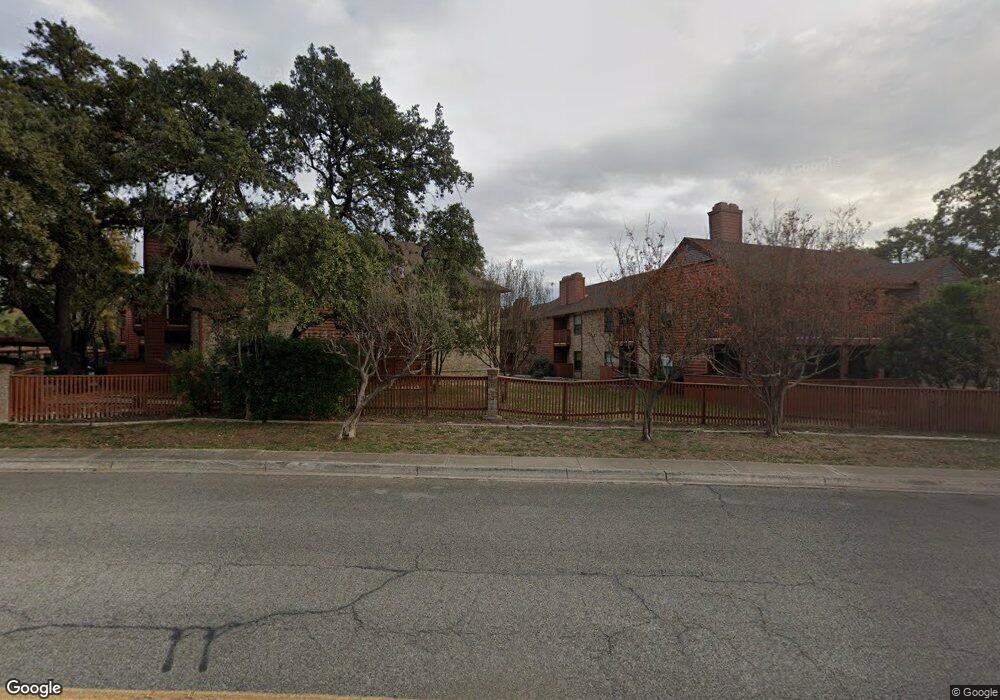
13018 Heimer Rd Unit 804 San Antonio, TX 78216
Brookhollow NeighborhoodEstimated Value: $138,000 - $156,000
2
Beds
1
Bath
823
Sq Ft
$180/Sq Ft
Est. Value
About This Home
This home is located at 13018 Heimer Rd Unit 804, San Antonio, TX 78216 and is currently estimated at $147,798, approximately $179 per square foot. 13018 Heimer Rd Unit 804 is a home located in Bexar County with nearby schools including Coker Elementary School, Bradley Middle, and Churchill High School.
Ownership History
Date
Name
Owned For
Owner Type
Purchase Details
Closed on
Oct 9, 2009
Sold by
Lara Joseph R and Lara Diana R
Bought by
Cervera Kathryn
Current Estimated Value
Home Financials for this Owner
Home Financials are based on the most recent Mortgage that was taken out on this home.
Original Mortgage
$80,023
Outstanding Balance
$52,307
Interest Rate
5.1%
Mortgage Type
FHA
Estimated Equity
$95,491
Purchase Details
Closed on
Jul 19, 2005
Sold by
Clarkson Laura R
Bought by
Chapa Ricardo J and Chapa Terese A
Home Financials for this Owner
Home Financials are based on the most recent Mortgage that was taken out on this home.
Original Mortgage
$52,200
Interest Rate
5.58%
Mortgage Type
Fannie Mae Freddie Mac
Purchase Details
Closed on
May 12, 1998
Sold by
Love Scruggs and Toledo Tony M
Bought by
Baker Christopher L and Clarkson Laura R
Home Financials for this Owner
Home Financials are based on the most recent Mortgage that was taken out on this home.
Original Mortgage
$35,185
Interest Rate
7.18%
Mortgage Type
FHA
Create a Home Valuation Report for This Property
The Home Valuation Report is an in-depth analysis detailing your home's value as well as a comparison with similar homes in the area
Home Values in the Area
Average Home Value in this Area
Purchase History
| Date | Buyer | Sale Price | Title Company |
|---|---|---|---|
| Cervera Kathryn | -- | Reliant Title Agency Llc | |
| Chapa Ricardo J | -- | Chicago Title | |
| Baker Christopher L | -- | -- |
Source: Public Records
Mortgage History
| Date | Status | Borrower | Loan Amount |
|---|---|---|---|
| Open | Cervera Kathryn | $80,023 | |
| Previous Owner | Chapa Ricardo J | $52,200 | |
| Previous Owner | Baker Christopher L | $35,185 |
Source: Public Records
Tax History Compared to Growth
Tax History
| Year | Tax Paid | Tax Assessment Tax Assessment Total Assessment is a certain percentage of the fair market value that is determined by local assessors to be the total taxable value of land and additions on the property. | Land | Improvement |
|---|---|---|---|---|
| 2025 | $2,136 | $153,320 | $15,300 | $138,020 |
| 2024 | $2,136 | $152,550 | $15,300 | $137,250 |
| 2023 | $2,136 | $139,005 | $15,300 | $137,250 |
| 2022 | $3,118 | $126,368 | $14,400 | $115,620 |
| 2021 | $2,935 | $114,880 | $7,920 | $106,960 |
| 2020 | $2,909 | $112,170 | $7,920 | $104,250 |
| 2019 | $2,747 | $103,140 | $7,920 | $95,220 |
| 2018 | $2,518 | $94,310 | $7,920 | $86,390 |
| 2017 | $2,373 | $88,055 | $7,920 | $86,390 |
| 2016 | $2,157 | $80,050 | $11,520 | $68,530 |
| 2015 | -- | $78,320 | $11,520 | $66,800 |
| 2014 | -- | $77,560 | $0 | $0 |
Source: Public Records
Map
Nearby Homes
- 13018 Heimer Rd Unit 805
- 13018 Heimer Rd Unit 703
- 13018 Heimer Rd Unit 421
- 13018 Heimer Rd Unit 210
- 12934 Country Ridge
- 4 Aubrey Ct
- 4975 Mala Vida
- 4979 Mala Vida
- 1319 E Bitters Rd
- 136 S Tower Dr
- 13607 Dutch Myrtle
- 13415 Lobelia St
- 1406 Aylsbury St
- 410 Shadowbluff Dr
- 13410 Lobelia St
- 13014 Trent St
- 1402 Brook Meadow
- 1500 Lochshire St
- 13029 Trent St
- 13026 Brook Garden Ln
- 13018 Heimer Rd Unit 808
- 13018 Heimer Rd Unit 1011
- 13018 Heimer Rd Unit 711
- 13018 Heimer Rd Unit 712
- 13018 Heimer Rd Unit 1017
- 13018 Heimer Rd
- 13018 Heimer Rd
- 13018 Heimer Rd
- 13018 Heimer Rd
- 13018 Heimer Rd
- 13018 Heimer Rd
- 13018 Heimer Rd
- 13018 Heimer Rd
- 13018 Heimer Rd
- 13018 Heimer Rd
- 13018 Heimer Rd
- 13018 Heimer Rd
- 13018 Heimer Rd
- 13018 Heimer Rd
- 13018 Heimer Rd