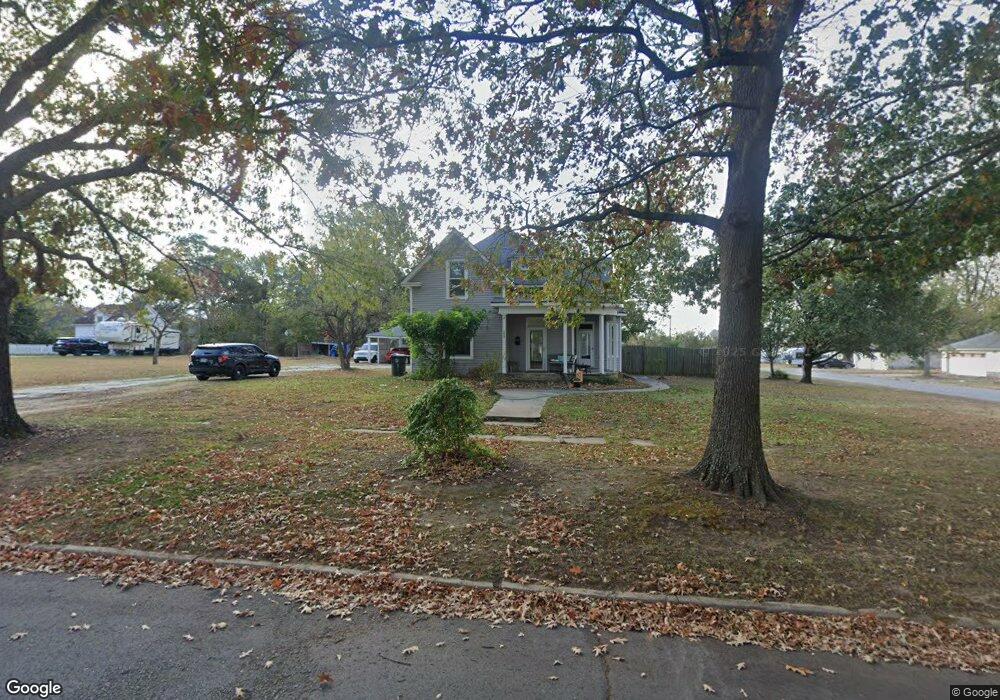
1302 E 9th St Okmulgee, OK 74447
Estimated Value: $136,000 - $148,000
3
Beds
2
Baths
1,881
Sq Ft
$76/Sq Ft
Est. Value
About This Home
This home is located at 1302 E 9th St, Okmulgee, OK 74447 and is currently estimated at $142,691, approximately $75 per square foot. 1302 E 9th St is a home located in Okmulgee County with nearby schools including Okmulgee Primary School, Dunbar Elementary School, and Okmulgee Middle School.
Ownership History
Date
Name
Owned For
Owner Type
Purchase Details
Closed on
Aug 13, 2008
Sold by
Saxon Mortgage Services Inc and Crockett John
Bought by
Patchin Smokey L and Patchin Jennifer Christina
Current Estimated Value
Home Financials for this Owner
Home Financials are based on the most recent Mortgage that was taken out on this home.
Original Mortgage
$45,000
Interest Rate
6.66%
Mortgage Type
Future Advance Clause Open End Mortgage
Purchase Details
Closed on
Apr 28, 2008
Sold by
Gribnitz Sasha K
Bought by
Saxon Mortgage Services Inc
Purchase Details
Closed on
Feb 1, 2006
Sold by
Laymon Barry and Laymon Rita A
Bought by
Gribnitz Kenneth W and Gribnitz Sasha K
Purchase Details
Closed on
May 7, 2003
Sold by
Herman Dianna L
Bought by
Laymon Barry
Purchase Details
Closed on
Jun 23, 1999
Sold by
Mobly Curits P and Mobly Donna
Bought by
Herman Dianna L
Create a Home Valuation Report for This Property
The Home Valuation Report is an in-depth analysis detailing your home's value as well as a comparison with similar homes in the area
Home Values in the Area
Average Home Value in this Area
Purchase History
| Date | Buyer | Sale Price | Title Company |
|---|---|---|---|
| Patchin Smokey L | $40,000 | Lawyers Title Of Oklahoma Ci | |
| Saxon Mortgage Services Inc | $87,258 | None Available | |
| Gribnitz Kenneth W | $87,000 | None Available | |
| Laymon Barry | $72,000 | -- | |
| Herman Dianna L | $59,500 | -- |
Source: Public Records
Mortgage History
| Date | Status | Borrower | Loan Amount |
|---|---|---|---|
| Closed | Patchin Smokey L | $45,000 | |
| Closed | Gribnitz Kenneth W | $0 |
Source: Public Records
Tax History
| Year | Tax Paid | Tax Assessment Tax Assessment Total Assessment is a certain percentage of the fair market value that is determined by local assessors to be the total taxable value of land and additions on the property. | Land | Improvement |
|---|---|---|---|---|
| 2025 | $444 | $5,848 | $720 | $5,128 |
| 2024 | $423 | $5,678 | $720 | $4,958 |
| 2023 | $398 | $5,676 | $720 | $4,956 |
| 2022 | $381 | $5,511 | $720 | $4,791 |
| 2021 | $385 | $5,511 | $720 | $4,791 |
| 2020 | $371 | $5,195 | $720 | $4,475 |
| 2019 | $357 | $5,044 | $720 | $4,324 |
| 2018 | $349 | $4,897 | $720 | $4,177 |
| 2017 | $333 | $4,755 | $720 | $4,035 |
| 2016 | $321 | $4,616 | $720 | $3,896 |
| 2015 | $388 | $5,507 | $450 | $5,057 |
| 2014 | $377 | $5,347 | $437 | $4,910 |
Source: Public Records
Map
Nearby Homes
Your Personal Tour Guide
Ask me questions while you tour the home.