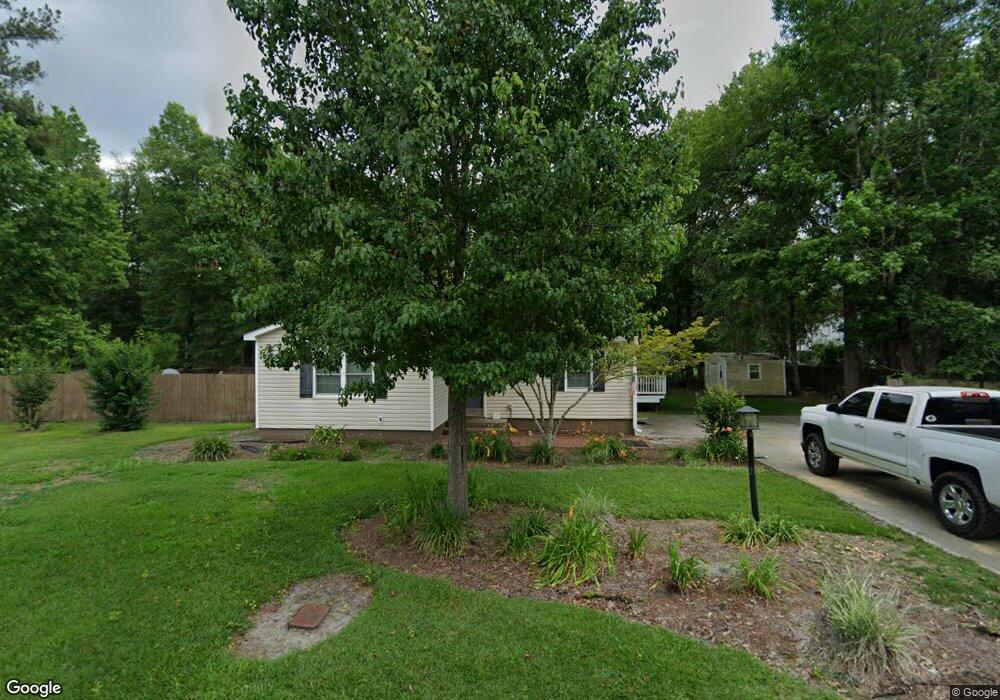
1302 Forest Way Nashville, GA 31639
Estimated Value: $206,341 - $254,000
5
Beds
2
Baths
2,304
Sq Ft
$100/Sq Ft
Est. Value
About This Home
This home is located at 1302 Forest Way, Nashville, GA 31639 and is currently estimated at $231,085, approximately $100 per square foot. 1302 Forest Way is a home located in Berrien County with nearby schools including Berrien Primary School, Berrien Elementary School, and Berrien Middle School.
Ownership History
Date
Name
Owned For
Owner Type
Purchase Details
Closed on
Aug 6, 2020
Sold by
Cribb April Lynn
Bought by
Cribb James Randall
Current Estimated Value
Home Financials for this Owner
Home Financials are based on the most recent Mortgage that was taken out on this home.
Original Mortgage
$143,816
Outstanding Balance
$70,488
Interest Rate
3%
Mortgage Type
New Conventional
Estimated Equity
$160,597
Purchase Details
Closed on
Jul 25, 2014
Sold by
Liotti Michael James
Bought by
Cribb April Lynn
Home Financials for this Owner
Home Financials are based on the most recent Mortgage that was taken out on this home.
Original Mortgage
$120,135
Interest Rate
4.19%
Mortgage Type
New Conventional
Purchase Details
Closed on
Sep 28, 2001
Sold by
Secretary Of Veteran
Bought by
Liotti Michael & Sa
Purchase Details
Closed on
Apr 3, 2001
Sold by
Homeside Lending
Bought by
Secretary Of Veteran
Purchase Details
Closed on
Nov 16, 1992
Bought by
Bobby Bobby G and Bobby Tuggle
Create a Home Valuation Report for This Property
The Home Valuation Report is an in-depth analysis detailing your home's value as well as a comparison with similar homes in the area
Home Values in the Area
Average Home Value in this Area
Purchase History
| Date | Buyer | Sale Price | Title Company |
|---|---|---|---|
| Cribb James Randall | $139,119 | -- | |
| Cribb April Lynn | $122,500 | -- | |
| Liotti Michael & Sa | -- | -- | |
| Secretary Of Veteran | -- | -- | |
| Homeside Lending | -- | -- | |
| Bobby Bobby G | $55,000 | -- |
Source: Public Records
Mortgage History
| Date | Status | Borrower | Loan Amount |
|---|---|---|---|
| Open | Cribb James Randall | $143,816 | |
| Previous Owner | Cribb April Lynn | $120,135 |
Source: Public Records
Tax History Compared to Growth
Tax History
| Year | Tax Paid | Tax Assessment Tax Assessment Total Assessment is a certain percentage of the fair market value that is determined by local assessors to be the total taxable value of land and additions on the property. | Land | Improvement |
|---|---|---|---|---|
| 2024 | -- | $50,322 | $2,756 | $47,566 |
| 2023 | $0 | $50,322 | $2,756 | $47,566 |
| 2022 | $1,953 | $50,322 | $2,756 | $47,566 |
| 2021 | $1,953 | $50,322 | $2,756 | $47,566 |
| 2020 | $1,437 | $45,316 | $2,756 | $42,560 |
| 2019 | $1,437 | $45,316 | $2,756 | $42,560 |
| 2018 | $1,759 | $45,316 | $2,756 | $42,560 |
| 2017 | $1,437 | $45,316 | $2,756 | $42,560 |
| 2016 | $1,396 | $45,316 | $2,756 | $42,560 |
| 2015 | -- | $45,316 | $2,756 | $42,560 |
| 2014 | -- | $39,326 | $2,756 | $36,570 |
| 2013 | -- | $39,170 | $2,600 | $36,570 |
Source: Public Records
Map
Nearby Homes
- 502 Sherwood Dr
- 1405 Azalea Way
- 1102 S Berrien St
- 1102 S Dogwood Dr
- 213 Chism Ave
- 805 S Berrien St
- 1507 S Dogwood Dr
- 1510 Cecil Rd
- 602 S Berrien St
- 713 Pall Mall Place
- 409 Abby St
- 309 S Dogwood Dr
- 205 S Dogwood Dr Unit K
- 514 W Mcpherson Ave
- 624 W Washington Ave
- 301 Kirby Cir
- .73AC Davis St
- 203 Guest Cir
- 206 N Bartow St
- 0 Anderson Rd
- 1304 Forest Way
- 1303 Woodland Way
- 1300 Forest Way
- 1303 Forest Way
- 1305 Forest Way
- 1307 Forest Way
- 1306 Woodland Way
- 1308 Forest Way
- 301 Sherwood Dr
- 1301 Forest Way
- 1309 Forest Way
- 1306 Azalea Way
- 1302 Azalea Way
- 1402 Forest Way
- 1401 Woodland Way
- 1310 Azalea Way
- 406 Mckinnon Dr
- 1202 S Berrien St
- 504 Cedar Dr
- 1400 Woodland Way