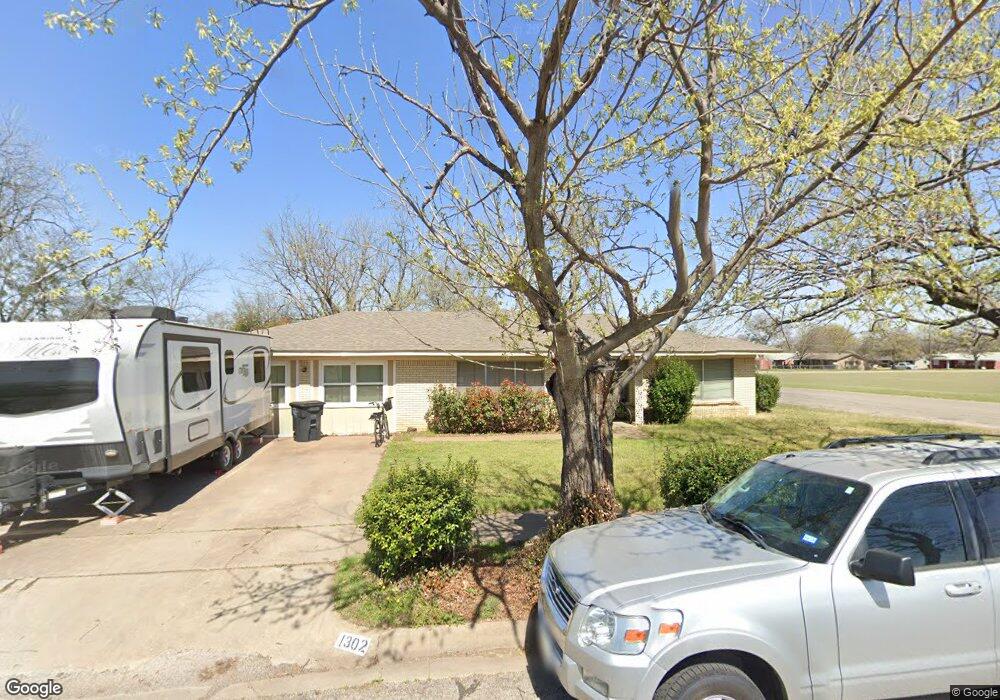
1302 Manor Dr Cleburne, TX 76033
Estimated Value: $220,000 - $254,000
3
Beds
2
Baths
1,876
Sq Ft
$125/Sq Ft
Est. Value
About This Home
This home is located at 1302 Manor Dr, Cleburne, TX 76033 and is currently estimated at $235,129, approximately $125 per square foot. 1302 Manor Dr is a home located in Johnson County with nearby schools including Cooke Elementary School, A.D. Wheat Middle School, and Cleburne High School.
Ownership History
Date
Name
Owned For
Owner Type
Purchase Details
Closed on
Sep 17, 2018
Sold by
Petty Michael P and Petty Danielle M
Bought by
White Joseph Levi
Current Estimated Value
Home Financials for this Owner
Home Financials are based on the most recent Mortgage that was taken out on this home.
Original Mortgage
$35,000
Outstanding Balance
$30,459
Interest Rate
4.5%
Mortgage Type
New Conventional
Estimated Equity
$204,670
Purchase Details
Closed on
Oct 7, 2016
Sold by
Fancon Llc
Bought by
Weiss Cody H and Weiss Vickie L
Home Financials for this Owner
Home Financials are based on the most recent Mortgage that was taken out on this home.
Original Mortgage
$226,000
Interest Rate
3.42%
Purchase Details
Closed on
Dec 18, 2015
Sold by
Russell Noah and Russell Erica
Bought by
Mccarver Jo Ann
Purchase Details
Closed on
Nov 25, 2013
Sold by
Upchurch Teresa and Upchurch O K
Bought by
Hernandez Carlos
Create a Home Valuation Report for This Property
The Home Valuation Report is an in-depth analysis detailing your home's value as well as a comparison with similar homes in the area
Home Values in the Area
Average Home Value in this Area
Purchase History
| Date | Buyer | Sale Price | Title Company |
|---|---|---|---|
| White Joseph Levi | -- | None Available | |
| Weiss Cody H | -- | None Available | |
| Mccarver Jo Ann | -- | None Available | |
| Hernandez Carlos | -- | Providence Title |
Source: Public Records
Mortgage History
| Date | Status | Borrower | Loan Amount |
|---|---|---|---|
| Open | White Joseph Levi | $35,000 | |
| Previous Owner | Weiss Cody H | $226,000 |
Source: Public Records
Tax History
| Year | Tax Paid | Tax Assessment Tax Assessment Total Assessment is a certain percentage of the fair market value that is determined by local assessors to be the total taxable value of land and additions on the property. | Land | Improvement |
|---|---|---|---|---|
| 2025 | $2,926 | $211,132 | $37,500 | $173,632 |
| 2024 | $4,292 | $192,479 | $0 | $0 |
| 2023 | $2,556 | $174,981 | $37,500 | $137,481 |
| 2022 | $4,038 | $174,981 | $37,500 | $137,481 |
| 2021 | $3,827 | $159,032 | $32,000 | $127,032 |
| 2020 | $3,695 | $133,360 | $22,000 | $111,360 |
| 2019 | $3,941 | $133,360 | $22,000 | $111,360 |
| 2018 | $2,680 | $90,660 | $20,000 | $70,660 |
| 2017 | $1,931 | $65,602 | $20,000 | $45,602 |
| 2016 | $1,784 | $60,602 | $15,000 | $45,602 |
Source: Public Records
Map
Nearby Homes
- 1413 Phillips St
- 1404 Mimosa St
- 905 Euclid St
- 1300 Holly St
- 1416 Mimosa St
- 809 Euclid St
- 805 Phillips St
- 1202 Holly St
- 1402 Dry Creek Dr
- 1123 Bales St
- 718 Turner St
- 1116 Poindexter Ave
- 1408 Quail Creek Dr
- 603 Lilly St
- 1102 Poindexter Ave
- 1102 Holly St
- 1418 Quail Creek Dr
- 440 Rose Ave
- 1105 Poindexter Ave
- 433 Rose Ave
Your Personal Tour Guide
Ask me questions while you tour the home.