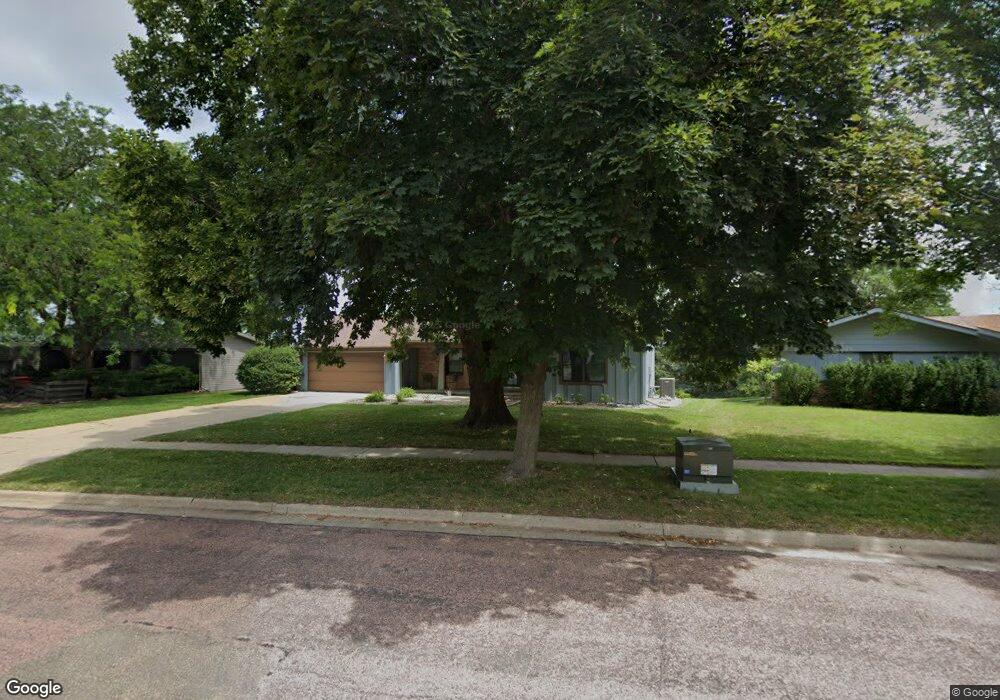
1302 Maple St Yankton, SD 57078
Estimated Value: $285,662 - $356,000
2
Beds
2
Baths
1,240
Sq Ft
$249/Sq Ft
Est. Value
About This Home
This home is located at 1302 Maple St, Yankton, SD 57078 and is currently estimated at $308,666, approximately $248 per square foot. 1302 Maple St is a home located in Yankton County with nearby schools including Lincoln Elementary School, Yankton Middle School - 02, and Yankton High School.
Ownership History
Date
Name
Owned For
Owner Type
Purchase Details
Closed on
Mar 1, 2017
Sold by
Huntley Aimee C
Bought by
Moser Nicholas G and Moser Ginny R
Current Estimated Value
Home Financials for this Owner
Home Financials are based on the most recent Mortgage that was taken out on this home.
Original Mortgage
$175,750
Outstanding Balance
$145,416
Interest Rate
4.09%
Mortgage Type
New Conventional
Estimated Equity
$163,250
Purchase Details
Closed on
Sep 17, 2007
Sold by
Schaap Randall R and Schaap Nancy J
Bought by
Mckenney Kathleen E
Create a Home Valuation Report for This Property
The Home Valuation Report is an in-depth analysis detailing your home's value as well as a comparison with similar homes in the area
Home Values in the Area
Average Home Value in this Area
Purchase History
| Date | Buyer | Sale Price | Title Company |
|---|---|---|---|
| Moser Nicholas G | $185,000 | Yankton Title Company | |
| Mckenney Kathleen E | $170,000 | Yankton Title |
Source: Public Records
Mortgage History
| Date | Status | Borrower | Loan Amount |
|---|---|---|---|
| Open | Moser Nicholas G | $175,750 |
Source: Public Records
Tax History
| Year | Tax Paid | Tax Assessment Tax Assessment Total Assessment is a certain percentage of the fair market value that is determined by local assessors to be the total taxable value of land and additions on the property. | Land | Improvement |
|---|---|---|---|---|
| 2025 | $3,585 | $285,500 | $17,100 | $268,400 |
| 2024 | $3,076 | $260,700 | $17,100 | $243,600 |
| 2023 | $2,861 | $212,200 | $17,100 | $195,100 |
| 2022 | $2,714 | $186,800 | $17,100 | $169,700 |
| 2021 | $2,707 | $174,600 | $17,100 | $157,500 |
| 2020 | $2,555 | $174,600 | $0 | $0 |
| 2019 | $2,452 | $174,600 | $0 | $0 |
| 2018 | $2,248 | $177,100 | $0 | $0 |
| 2017 | $2,310 | $162,500 | $0 | $0 |
| 2016 | -- | $162,500 | $0 | $0 |
| 2015 | -- | $159,400 | $0 | $0 |
| 2014 | -- | $159,400 | $0 | $0 |
| 2013 | -- | $156,800 | $0 | $0 |
Source: Public Records
Map
Nearby Homes
Your Personal Tour Guide
Ask me questions while you tour the home.