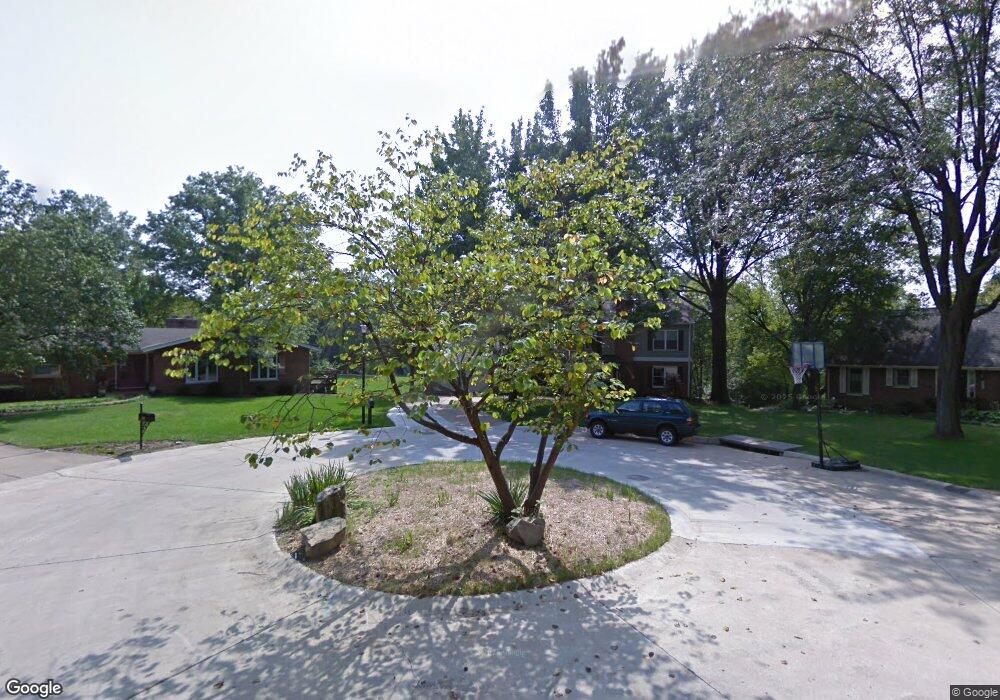
1302 Marbendale Ct Saint Louis, MO 63122
Estimated Value: $565,000 - $825,000
4
Beds
4
Baths
2,784
Sq Ft
$237/Sq Ft
Est. Value
About This Home
This home is located at 1302 Marbendale Ct, Saint Louis, MO 63122 and is currently estimated at $660,123, approximately $237 per square foot. 1302 Marbendale Ct is a home located in St. Louis County with nearby schools including George R. Robinson Elementary School, Nipher Middle School, and Kirkwood Senior High School.
Ownership History
Date
Name
Owned For
Owner Type
Purchase Details
Closed on
Apr 21, 2003
Sold by
Toigo David A
Bought by
Toigo David A and Toigo Karen D
Current Estimated Value
Home Financials for this Owner
Home Financials are based on the most recent Mortgage that was taken out on this home.
Original Mortgage
$240,000
Outstanding Balance
$93,608
Interest Rate
4.5%
Mortgage Type
Purchase Money Mortgage
Estimated Equity
$566,515
Purchase Details
Closed on
Nov 16, 2001
Sold by
Toigo David A
Bought by
Toigo David A and David A Toigo Revocable Trust
Purchase Details
Closed on
Apr 5, 2000
Sold by
Beabout Scott W and Beabout Amy K
Bought by
Toigo David A and Toigo Melissa A
Home Financials for this Owner
Home Financials are based on the most recent Mortgage that was taken out on this home.
Original Mortgage
$240,000
Interest Rate
7.87%
Purchase Details
Closed on
Apr 25, 1997
Sold by
Beabout Scott W and Beabout Amyk
Bought by
Beabout Scott W and Beabout Amy K
Create a Home Valuation Report for This Property
The Home Valuation Report is an in-depth analysis detailing your home's value as well as a comparison with similar homes in the area
Home Values in the Area
Average Home Value in this Area
Purchase History
| Date | Buyer | Sale Price | Title Company |
|---|---|---|---|
| Toigo David A | -- | -- | |
| Toigo David A | -- | -- | |
| Toigo David A | $300,000 | -- | |
| Beabout Scott W | -- | -- |
Source: Public Records
Mortgage History
| Date | Status | Borrower | Loan Amount |
|---|---|---|---|
| Open | Toigo David A | $240,000 | |
| Previous Owner | Toigo David A | $240,000 |
Source: Public Records
Tax History Compared to Growth
Tax History
| Year | Tax Paid | Tax Assessment Tax Assessment Total Assessment is a certain percentage of the fair market value that is determined by local assessors to be the total taxable value of land and additions on the property. | Land | Improvement |
|---|---|---|---|---|
| 2025 | $6,168 | $117,590 | $55,900 | $61,690 |
| 2024 | $6,168 | $99,330 | $40,280 | $59,050 |
| 2023 | $6,071 | $99,330 | $40,280 | $59,050 |
| 2022 | $6,038 | $92,170 | $40,280 | $51,890 |
| 2021 | $5,959 | $92,170 | $40,280 | $51,890 |
| 2020 | $6,424 | $95,590 | $38,460 | $57,130 |
| 2019 | $6,491 | $95,590 | $38,460 | $57,130 |
| 2018 | $5,671 | $73,720 | $24,740 | $48,980 |
| 2017 | $5,664 | $73,720 | $24,740 | $48,980 |
| 2016 | $5,448 | $71,460 | $20,770 | $50,690 |
| 2015 | $5,098 | $67,660 | $20,770 | $46,890 |
| 2014 | $5,336 | $69,290 | $12,270 | $57,020 |
Source: Public Records
Map
Nearby Homes
- 11922 Big Bend Rd
- 1010 Station Bend Ln
- 1889 N Signal Hills Dr
- 1264 Wilton Ln
- 1016 Forest Ave
- 680 Craigwoods Dr
- 726 S Ballas Rd
- 602 S Ballas Rd
- 1053 Geyer Grove Unit 9
- 621 Crest Ct
- 514 Coulter Ave
- 406 Meyer Ave
- 416 S Ballas Rd
- 717 Mclain Ln
- 1920 Hunting Lake Ct Unit 202
- 1 Boxwood Ln
- 1211 S Geyer Rd
- 52 Tbb Ponca Trail
- 1001 Barberry Ln
- 1932 Green Glen Dr Unit 304
- 1301 Marbendale Ct
- 1306 Marbendale Ct
- 1051 Glenford Ct
- 1057 Glenford Ct
- 1043 Glenford Ct
- 1322 Marbendale Ct
- 1321 Marbendale Ct
- 1035 Glenford Ct
- 1334 Marbendale Ct
- 1058 Glenford Ct
- 1301 Charmwood Dr
- 1027 Glenford Ct
- 1048 Glenford Ct
- 1054 Glenford Ct
- 1333 Marbendale Ct
- 1040 Glenford Ct
- 1289 Charmwood Dr
- 1342 Marbendale Ct
- 1522 Marshall Rd
- 1021 Glenford Ct