Estimated Value: $112,000 - $148,000
3
Beds
1
Bath
1,050
Sq Ft
$125/Sq Ft
Est. Value
About This Home
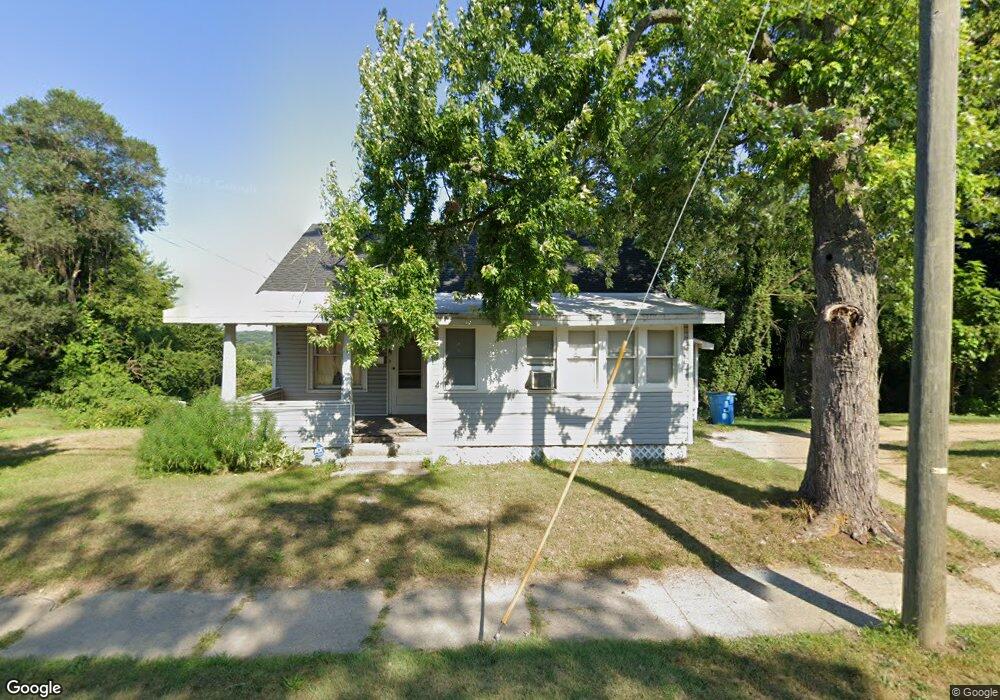
This home is located at 1302 N 5th St, Niles, MI 49120 and is currently estimated at $131,087, approximately $124 per square foot. 1302 N 5th St is a home located in Berrien County with nearby schools including James Ellis School, Howard-Ellis Elementary School, and Ring Lardner Middle School.
Ownership History
Date
Name
Owned For
Owner Type
Purchase Details
Closed on
Sep 7, 2018
Sold by
Harbourportfolio Viii Lp
Bought by
Headlands Alternative Investments Lp
Current Estimated Value
Purchase Details
Closed on
Dec 6, 2013
Sold by
Federal National Mortgage Association
Bought by
Harbour Portfolio Viii Lp
Purchase Details
Closed on
Jun 11, 2012
Sold by
Jpmorgan Chase Bank National Association
Bought by
Fannie Mae and Federal National Mortgage Association
Purchase Details
Closed on
Dec 8, 2011
Sold by
Swanson Victor K
Bought by
Jpmorgan Chase Bank National Association
Purchase Details
Closed on
Jul 24, 2009
Sold by
Tughan Elaine C
Bought by
Swanson Victor Karle
Purchase Details
Closed on
Aug 23, 1999
Purchase Details
Closed on
Jul 20, 1999
Create a Home Valuation Report for This Property
The Home Valuation Report is an in-depth analysis detailing your home's value as well as a comparison with similar homes in the area
Home Values in the Area
Average Home Value in this Area
Purchase History
| Date | Buyer | Sale Price | Title Company |
|---|---|---|---|
| Headlands Alternative Investments Lp | -- | None Available | |
| Harbour Portfolio Viii Lp | $9,814 | Servicelink | |
| Fannie Mae | -- | None Available | |
| Jpmorgan Chase Bank National Association | $41,526 | None Available | |
| Swanson Victor Karle | -- | None Available | |
| -- | $35,400 | -- | |
| -- | $100 | -- |
Source: Public Records
Tax History Compared to Growth
Tax History
| Year | Tax Paid | Tax Assessment Tax Assessment Total Assessment is a certain percentage of the fair market value that is determined by local assessors to be the total taxable value of land and additions on the property. | Land | Improvement |
|---|---|---|---|---|
| 2025 | $2,828 | $47,400 | $0 | $0 |
| 2024 | $743 | $46,400 | $0 | $0 |
| 2023 | $712 | $35,300 | $0 | $0 |
| 2022 | $678 | $25,600 | $0 | $0 |
| 2021 | $1,238 | $23,900 | $2,700 | $21,200 |
| 2020 | $1,223 | $23,400 | $0 | $0 |
| 2019 | $1,206 | $21,700 | $2,600 | $19,100 |
| 2018 | $1,162 | $21,700 | $0 | $0 |
| 2017 | $2,298 | $25,300 | $0 | $0 |
| 2016 | $1,129 | $20,100 | $0 | $0 |
| 2015 | $1,411 | $25,200 | $0 | $0 |
| 2014 | $654 | $21,900 | $0 | $0 |
Source: Public Records
Map
Nearby Homes
- 1201 N 6th St
- 1603 N 5th St
- 2802 Primrose Ct
- 1610 N 5th St
- 232 Pokagon St
- 712 Wayne St
- 98 River St
- 501 & 505 N Twelfth St
- 645 N 11th St
- 1123 N 9th St
- 1630 Forest Trail
- 622 N 13th St
- 8 Marmont St
- 810 Ferry St
- 1405 Sheffield Ave
- 709 Regent St
- 211 N 8th St
- 1314 Ferry St
- 534 James St
- 31829 Heritage Place