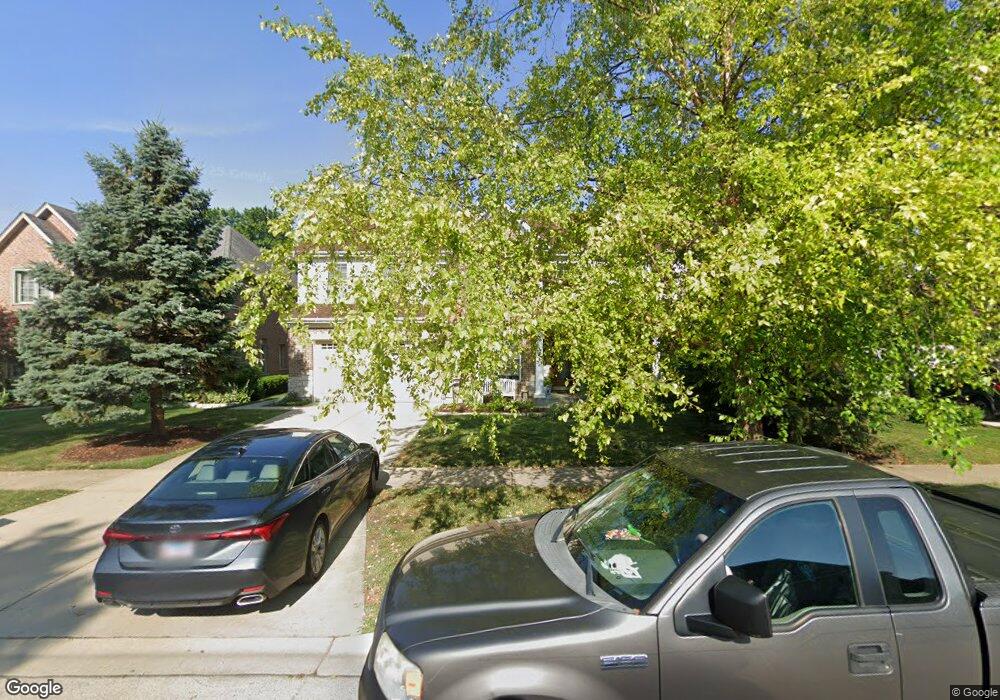
1302 N Illinois Ave Arlington Heights, IL 60004
Estimated Value: $1,135,000 - $1,260,000
4
Beds
4
Baths
3,517
Sq Ft
$344/Sq Ft
Est. Value
About This Home
This home is located at 1302 N Illinois Ave, Arlington Heights, IL 60004 and is currently estimated at $1,208,391, approximately $343 per square foot. 1302 N Illinois Ave is a home located in Cook County with nearby schools including Patton Elementary School, Thomas Middle School, and John Hersey High School.
Ownership History
Date
Name
Owned For
Owner Type
Purchase Details
Closed on
Jan 30, 2007
Sold by
Gecan Martin
Bought by
Kent John A
Current Estimated Value
Home Financials for this Owner
Home Financials are based on the most recent Mortgage that was taken out on this home.
Original Mortgage
$630,000
Outstanding Balance
$378,600
Interest Rate
6.22%
Mortgage Type
New Conventional
Estimated Equity
$829,791
Purchase Details
Closed on
Nov 24, 2003
Sold by
Leese Charles P
Bought by
Gecan Martin
Purchase Details
Closed on
Jun 27, 1997
Sold by
Chandler William F and Chandler Denise R
Bought by
Leese Charles P
Home Financials for this Owner
Home Financials are based on the most recent Mortgage that was taken out on this home.
Original Mortgage
$152,863
Interest Rate
8.01%
Mortgage Type
FHA
Create a Home Valuation Report for This Property
The Home Valuation Report is an in-depth analysis detailing your home's value as well as a comparison with similar homes in the area
Home Values in the Area
Average Home Value in this Area
Purchase History
| Date | Buyer | Sale Price | Title Company |
|---|---|---|---|
| Kent John A | $787,500 | Attorneys Title Guaranty Fun | |
| Gecan Martin | $219,500 | Multiple | |
| Leese Charles P | $158,500 | -- |
Source: Public Records
Mortgage History
| Date | Status | Borrower | Loan Amount |
|---|---|---|---|
| Open | Kent John A | $630,000 | |
| Previous Owner | Leese Charles P | $152,863 |
Source: Public Records
Tax History Compared to Growth
Tax History
| Year | Tax Paid | Tax Assessment Tax Assessment Total Assessment is a certain percentage of the fair market value that is determined by local assessors to be the total taxable value of land and additions on the property. | Land | Improvement |
|---|---|---|---|---|
| 2024 | $21,755 | $82,783 | $6,316 | $76,467 |
| 2023 | $20,924 | $82,783 | $6,316 | $76,467 |
| 2022 | $20,924 | $82,783 | $6,316 | $76,467 |
| 2021 | $18,513 | $64,831 | $4,573 | $60,258 |
| 2020 | $18,101 | $64,831 | $4,573 | $60,258 |
| 2019 | $18,055 | $72,195 | $4,573 | $67,622 |
| 2018 | $18,492 | $66,804 | $3,920 | $62,884 |
| 2017 | $18,292 | $66,804 | $3,920 | $62,884 |
| 2016 | $17,296 | $66,804 | $3,920 | $62,884 |
| 2015 | $15,239 | $54,234 | $3,484 | $50,750 |
| 2014 | $14,810 | $54,234 | $3,484 | $50,750 |
| 2013 | $14,420 | $54,234 | $3,484 | $50,750 |
Source: Public Records
Map
Nearby Homes
- 1326 N Race Ave
- 628 S Wilke Rd
- 543 S Warren Ave
- 1750 W Thomas St
- 1416 W Lynnwood Ave
- 1605 N Chicago Ave
- 1518 N Patton Ave
- 1542 E Baronet Ln Unit 120300
- 1418 W Maude Ave
- 1237 N Ridge Ave
- 1136 N Walnut Ave
- 1142 N Mitchell Ave
- 1317 N Mitchell Ave
- 617 N Wilke Rd
- 1417 E Joyce Ave
- 1825 N Kaspar Ave
- 827 N Walnut Ave
- 910 N Chestnut Ave
- 924 N Highland Ave
- 1422 E Dorothy Dr
- 1260 N Illinois Ave
- 1310 N Illinois Ave
- 1301 N Chicago Ave
- 1256 N Illinois Ave
- 1259 N Chicago Ave
- 1309 N Chicago Ave
- 1314 N Illinois Ave
- 1255 N Chicago Ave
- 1301 N Illinois Ave
- 1252 N Illinois Ave
- 1313 N Chicago Ave
- 1318 N Illinois Ave
- 1257 N Illinois Ave
- 1309 N Illinois Ave
- 1317 N Chicago Ave
- 1248 N Illinois Ave
- 1315 N Illinois Ave
- 1322 N Illinois Ave
- 1247 N Chicago Ave
- 1321 N Chicago Ave