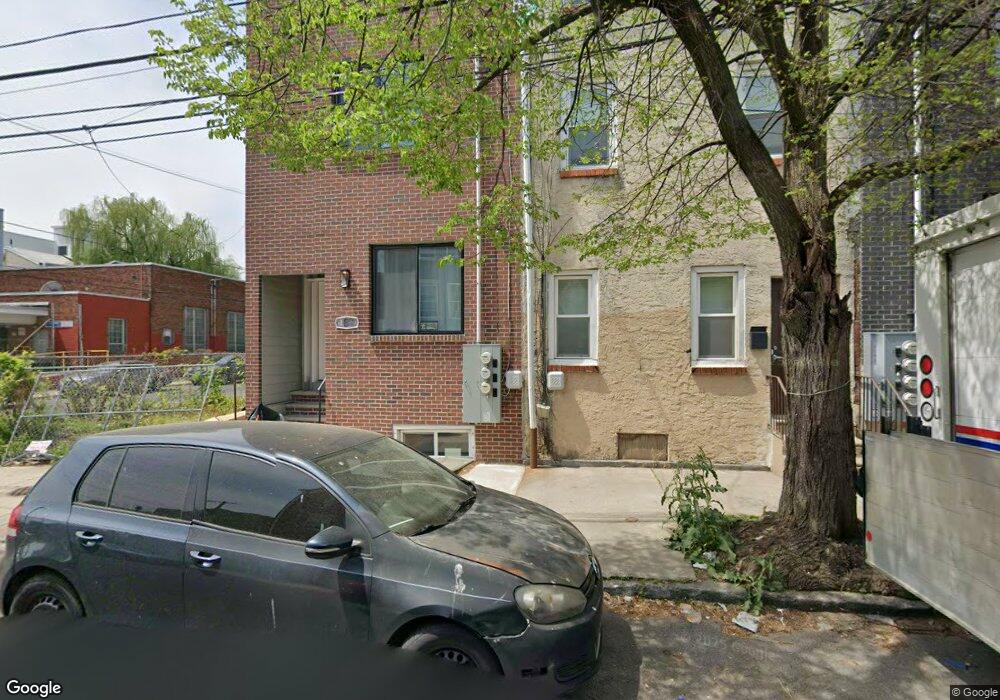
1302 N Marshall St Unit 1 Philadelphia, PA 19122
Ludlow NeighborhoodEstimated Value: $177,000 - $803,000
3
Beds
2
Baths
1,500
Sq Ft
$426/Sq Ft
Est. Value
About This Home
This home is located at 1302 N Marshall St Unit 1, Philadelphia, PA 19122 and is currently estimated at $639,665, approximately $426 per square foot. 1302 N Marshall St Unit 1 is a home located in Philadelphia County with nearby schools including James R. Ludlow School, Penn Treaty School, and Young Scholars Charter School.
Ownership History
Date
Name
Owned For
Owner Type
Purchase Details
Closed on
Dec 8, 2020
Sold by
Kupa Destan and Kupa Shyqirie
Bought by
Razavi Nima
Current Estimated Value
Home Financials for this Owner
Home Financials are based on the most recent Mortgage that was taken out on this home.
Original Mortgage
$520,000
Outstanding Balance
$418,736
Interest Rate
2.7%
Mortgage Type
New Conventional
Estimated Equity
$220,929
Purchase Details
Closed on
Nov 25, 2019
Sold by
Ahn Llc
Bought by
Kupa Destan and Kupa Shyqirie
Purchase Details
Closed on
Sep 17, 2016
Sold by
Ahn Llc
Bought by
Michelson David and Ahn Yeomni
Purchase Details
Closed on
Jan 14, 2016
Sold by
Finite Developers Llc
Bought by
Ahn Llc
Purchase Details
Closed on
Aug 6, 2014
Sold by
Estate Of Inez Thomas
Bought by
Finite Developers Llc
Purchase Details
Closed on
Jun 3, 1959
Bought by
Samuel Samuel F and Samuel Inez
Create a Home Valuation Report for This Property
The Home Valuation Report is an in-depth analysis detailing your home's value as well as a comparison with similar homes in the area
Home Values in the Area
Average Home Value in this Area
Purchase History
| Date | Buyer | Sale Price | Title Company |
|---|---|---|---|
| Razavi Nima | $650,000 | Commonground Abstract Llc | |
| Kupa Destan | $168,000 | Commonground Abstract Llc | |
| Michelson David | $243,149 | None Available | |
| Ahn Llc | $117,500 | Assurance Abstract Corp | |
| Finite Developers Llc | $48,000 | None Available | |
| Samuel Samuel F | $7,000 | -- |
Source: Public Records
Mortgage History
| Date | Status | Borrower | Loan Amount |
|---|---|---|---|
| Open | Razavi Nima | $520,000 |
Source: Public Records
Tax History Compared to Growth
Tax History
| Year | Tax Paid | Tax Assessment Tax Assessment Total Assessment is a certain percentage of the fair market value that is determined by local assessors to be the total taxable value of land and additions on the property. | Land | Improvement |
|---|---|---|---|---|
| 2026 | $2,570 | $669,500 | $133,900 | $535,600 |
| 2025 | $2,570 | $669,500 | $133,900 | $535,600 |
| 2024 | $2,570 | $669,500 | $133,900 | $535,600 |
| 2023 | $2,570 | $644,100 | $183,600 | $460,500 |
| 2022 | $2,570 | $183,600 | $183,600 | $0 |
| 2021 | $566 | $0 | $0 | $0 |
| 2020 | $566 | $0 | $0 | $0 |
| 2019 | $566 | $0 | $0 | $0 |
| 2018 | $566 | $0 | $0 | $0 |
| 2017 | $566 | $0 | $0 | $0 |
| 2016 | $1,474 | $0 | $0 | $0 |
| 2015 | -- | $0 | $0 | $0 |
| 2014 | -- | $105,300 | $7,611 | $97,689 |
| 2012 | -- | $5,280 | $1,834 | $3,446 |
Source: Public Records
Map
Nearby Homes
- 938-40 N Marshall St Unit 3
- 1238 N 6th St Unit B
- 1212 N 7th St
- 1325 N Franklin St
- 614 W Master St Unit 1
- 614 W Master St Unit 2
- 1334 N 7th St
- 1336 N 7th St
- 1225 N 6th St
- 619 W Girard Ave
- 621 W Girard Ave
- 623 W Girard Ave
- 1337 N Franklin St
- 1401 N 7th St
- 1232 N Randolph St
- 1403 N 7th St
- 1211 N Franklin St
- 1307 N Randolph St
- 1338 N Franklin St Unit C
- 1338 N Franklin St Unit B
- 1302 N Marshall St Unit 2
- 1302 N Marshall St Unit A
- 1302 N Marshall St
- 1304 N Marshall St
- 1306 N Marshall St
- 625 W Thompson St
- 1309 N 7th St
- 1303 N 7th St
- 1307 N 7th St
- 1307 N 7th St Unit 1
- 1303 N Marshall St
- 1305 N Marshall St
- 1301 N Marshall St
- 1301 N 7th St
- 1311 N 7th St
- 1318 N Marshall St
- 1309 N Marshall St
- 1307 N Marshall St Unit 1R
- 1307 N Marshall St Unit 1F
- 1307 N Marshall St Unit 2F