Estimated Value: $178,992 - $196,000
3
Beds
2
Baths
1,612
Sq Ft
$117/Sq Ft
Est. Value
About This Home
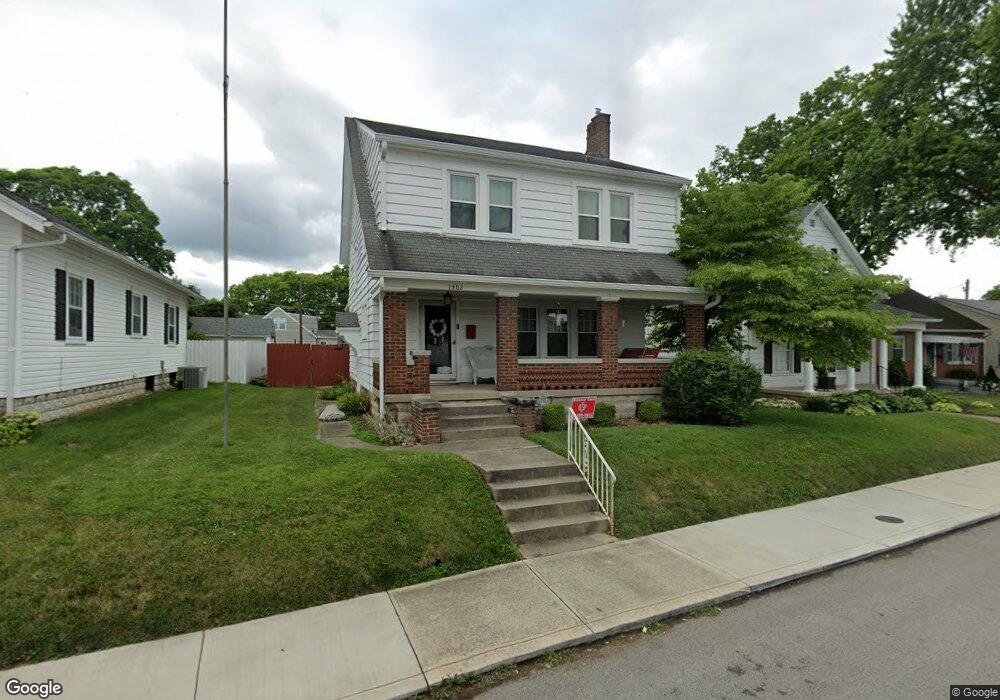
This home is located at 1302 Nicklin Ave, Piqua, OH 45356 and is currently estimated at $188,498, approximately $116 per square foot. 1302 Nicklin Ave is a home located in Miami County with nearby schools including Piqua Central Intermediate School, Springcreek Primary School, and Piqua Junior High School.
Ownership History
Date
Name
Owned For
Owner Type
Purchase Details
Closed on
Jul 22, 2021
Sold by
Wolfe Christopher T
Bought by
Wolfe Christopher T and Wolfe Wendy L
Current Estimated Value
Purchase Details
Closed on
Jul 28, 2015
Sold by
U S Bank National Association
Bought by
The Secretary Of Housing & Urban Develop
Purchase Details
Closed on
Jan 27, 2014
Sold by
Kraft Michael A
Bought by
U S Bank National Association
Purchase Details
Closed on
Dec 6, 2013
Sold by
Kraft Michael A
Bought by
U S Bank National Association
Purchase Details
Closed on
Dec 26, 2002
Sold by
Rasor Scott E and Rasor Julie S
Bought by
Kraft Michael A
Home Financials for this Owner
Home Financials are based on the most recent Mortgage that was taken out on this home.
Original Mortgage
$107,512
Interest Rate
6.01%
Mortgage Type
FHA
Purchase Details
Closed on
Nov 9, 1989
Bought by
Rasor Scott E
Create a Home Valuation Report for This Property
The Home Valuation Report is an in-depth analysis detailing your home's value as well as a comparison with similar homes in the area
Home Values in the Area
Average Home Value in this Area
Purchase History
| Date | Buyer | Sale Price | Title Company |
|---|---|---|---|
| Wolfe Christopher T | -- | None Available | |
| The Secretary Of Housing & Urban Develop | -- | Attorney | |
| U S Bank National Association | $50,000 | None Available | |
| U S Bank National Association | $50,000 | Attorney | |
| Kraft Michael A | $109,200 | -- | |
| Rasor Scott E | $53,100 | -- |
Source: Public Records
Mortgage History
| Date | Status | Borrower | Loan Amount |
|---|---|---|---|
| Previous Owner | Kraft Michael A | $107,512 |
Source: Public Records
Tax History Compared to Growth
Tax History
| Year | Tax Paid | Tax Assessment Tax Assessment Total Assessment is a certain percentage of the fair market value that is determined by local assessors to be the total taxable value of land and additions on the property. | Land | Improvement |
|---|---|---|---|---|
| 2024 | $1,591 | $37,740 | $9,350 | $28,390 |
| 2023 | $1,591 | $37,740 | $9,350 | $28,390 |
| 2022 | $1,619 | $37,740 | $9,350 | $28,390 |
| 2021 | $1,357 | $29,020 | $7,180 | $21,840 |
| 2020 | $1,334 | $29,020 | $7,180 | $21,840 |
| 2019 | $1,341 | $29,020 | $7,180 | $21,840 |
| 2018 | $1,135 | $23,420 | $7,460 | $15,960 |
| 2017 | $1,149 | $23,420 | $7,460 | $15,960 |
| 2016 | $1,138 | $23,420 | $7,460 | $15,960 |
| 2015 | $1,088 | $22,510 | $7,180 | $15,330 |
| 2014 | $1,088 | $22,510 | $7,180 | $15,330 |
| 2013 | $1,092 | $22,510 | $7,180 | $15,330 |
Source: Public Records
Map
Nearby Homes
- 1300 Nicklin Ave
- 1304 Nicklin Ave
- 1306 Nicklin Ave
- 724 Robinson Ave
- 1308 Nicklin Ave
- 1222 Nicklin Ave
- 705 Robinson Ave
- 614 Robinson Ave
- 723 Robinson Ave
- 612 Robinson Ave
- 1220 Nicklin Ave
- 726 Robinson Ave
- 1303 Nicklin Ave
- 701 Lindsey St
- 1305 Nicklin Ave
- 705 Lindsey St
- 610 Robinson Ave
- 725 Robinson Ave
- 1307 Walker St
- 1307 Walker St