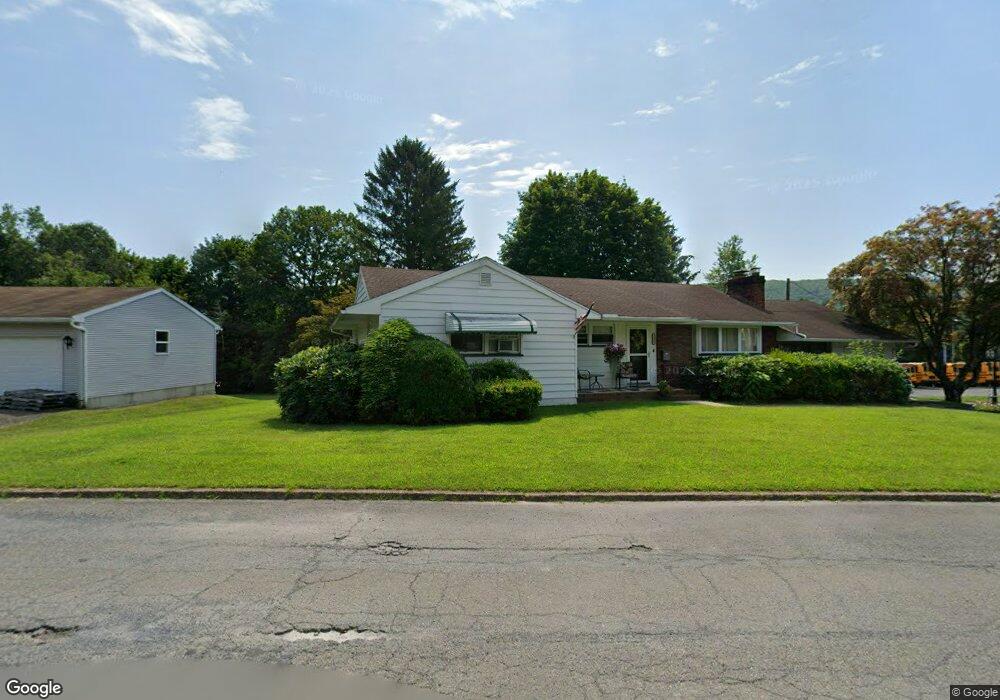
1302 Orchard Ln Jim Thorpe, PA 18229
Estimated Value: $246,000 - $351,000
3
Beds
2
Baths
1,460
Sq Ft
$197/Sq Ft
Est. Value
About This Home
This home is located at 1302 Orchard Ln, Jim Thorpe, PA 18229 and is currently estimated at $288,120, approximately $197 per square foot. 1302 Orchard Ln is a home located in Carbon County with nearby schools including Jim Thorpe Area High School.
Ownership History
Date
Name
Owned For
Owner Type
Purchase Details
Closed on
Mar 9, 2020
Sold by
Heaney Patricia E
Bought by
Heaney Patricia E and Kuhn Mary Alice
Current Estimated Value
Purchase Details
Closed on
Jun 4, 2008
Sold by
Myers Marjorie A
Bought by
Heaney Aloysius J and Heaney Patricia E
Home Financials for this Owner
Home Financials are based on the most recent Mortgage that was taken out on this home.
Original Mortgage
$163,103
Outstanding Balance
$104,983
Interest Rate
6.11%
Mortgage Type
New Conventional
Estimated Equity
$183,137
Purchase Details
Closed on
Oct 31, 2007
Sold by
Remmel Orpha M
Bought by
Myers Robert A and Myers Marjorie A
Home Financials for this Owner
Home Financials are based on the most recent Mortgage that was taken out on this home.
Original Mortgage
$130,000
Interest Rate
6.43%
Mortgage Type
New Conventional
Create a Home Valuation Report for This Property
The Home Valuation Report is an in-depth analysis detailing your home's value as well as a comparison with similar homes in the area
Home Values in the Area
Average Home Value in this Area
Purchase History
| Date | Buyer | Sale Price | Title Company |
|---|---|---|---|
| Heaney Patricia E | -- | None Available | |
| Heaney Aloysius J | $160,000 | None Available | |
| Myers Robert A | $162,500 | None Available |
Source: Public Records
Mortgage History
| Date | Status | Borrower | Loan Amount |
|---|---|---|---|
| Open | Heaney Aloysius J | $163,103 | |
| Previous Owner | Myers Robert A | $130,000 |
Source: Public Records
Tax History Compared to Growth
Tax History
| Year | Tax Paid | Tax Assessment Tax Assessment Total Assessment is a certain percentage of the fair market value that is determined by local assessors to be the total taxable value of land and additions on the property. | Land | Improvement |
|---|---|---|---|---|
| 2025 | $4,008 | $50,500 | $14,500 | $36,000 |
| 2024 | $3,857 | $50,500 | $14,500 | $36,000 |
| 2023 | $3,787 | $50,500 | $14,500 | $36,000 |
| 2022 | $3,726 | $50,500 | $14,500 | $36,000 |
| 2021 | $3,726 | $50,500 | $14,500 | $36,000 |
| 2020 | $3,561 | $50,500 | $14,500 | $36,000 |
| 2019 | $3,461 | $50,000 | $14,500 | $35,500 |
| 2018 | $3,384 | $50,000 | $14,500 | $35,500 |
| 2017 | $3,284 | $50,000 | $14,500 | $35,500 |
| 2016 | -- | $50,000 | $14,500 | $35,500 |
| 2015 | -- | $50,000 | $14,500 | $35,500 |
| 2014 | -- | $50,000 | $14,500 | $35,500 |
Source: Public Records
Map
Nearby Homes
- 0 W Thirteenth St Unit PM-121866
- 812 Lehigh St
- 705 Center St
- 617 Center St
- 514 North St
- 25 E 5th St
- 515 North St
- 432 Center St
- 15 W 5th St Unit 17
- 226 Fern St
- 218 Center St
- 115 Center St
- 59 W Front St
- 11 E Front St
- 95 Center Ave
- 118 South Ave
- 223 North Ave
- 0 N Dr Unit PM-116531
- 23 Race St
- 23-25 Race St