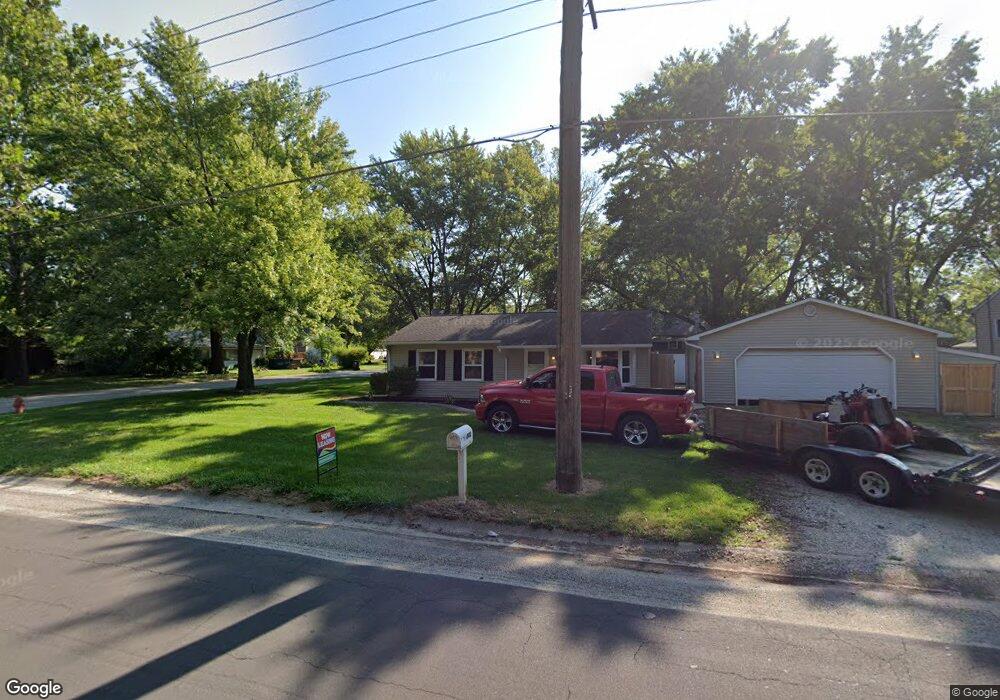
1302 S Duncan Rd Unit 1 Champaign, IL 61821
Estimated Value: $140,000 - $165,829
3
Beds
1
Bath
904
Sq Ft
$170/Sq Ft
Est. Value
About This Home
This home is located at 1302 S Duncan Rd Unit 1, Champaign, IL 61821 and is currently estimated at $153,957, approximately $170 per square foot. 1302 S Duncan Rd Unit 1 is a home located in Champaign County with nearby schools including Centennial High School, Swann Special Care Center-Elem/Secondary School, and Countryside School.
Ownership History
Date
Name
Owned For
Owner Type
Purchase Details
Closed on
Mar 30, 2023
Sold by
Unity Homes Llc
Bought by
Cox Property Group Llc
Current Estimated Value
Home Financials for this Owner
Home Financials are based on the most recent Mortgage that was taken out on this home.
Original Mortgage
$95,625
Outstanding Balance
$53,261
Interest Rate
6.5%
Mortgage Type
New Conventional
Estimated Equity
$100,696
Purchase Details
Closed on
Oct 28, 2021
Sold by
Elson Evan M
Bought by
Unity Homes Llc
Home Financials for this Owner
Home Financials are based on the most recent Mortgage that was taken out on this home.
Original Mortgage
$84,000
Interest Rate
2.8%
Mortgage Type
Commercial
Purchase Details
Closed on
Jun 30, 2011
Sold by
Weeks Robert T and Weeks Megan K
Bought by
Martin Mallory M
Home Financials for this Owner
Home Financials are based on the most recent Mortgage that was taken out on this home.
Original Mortgage
$92,455
Interest Rate
5.5%
Mortgage Type
FHA
Create a Home Valuation Report for This Property
The Home Valuation Report is an in-depth analysis detailing your home's value as well as a comparison with similar homes in the area
Home Values in the Area
Average Home Value in this Area
Purchase History
| Date | Buyer | Sale Price | Title Company |
|---|---|---|---|
| Cox Property Group Llc | $112,500 | None Listed On Document | |
| Unity Homes Llc | $105,000 | None Available | |
| Martin Mallory M | $96,000 | None Available |
Source: Public Records
Mortgage History
| Date | Status | Borrower | Loan Amount |
|---|---|---|---|
| Open | Cox Property Group Llc | $95,625 | |
| Previous Owner | Unity Homes Llc | $84,000 | |
| Previous Owner | Martin Mallory M | $92,455 |
Source: Public Records
Tax History Compared to Growth
Tax History
| Year | Tax Paid | Tax Assessment Tax Assessment Total Assessment is a certain percentage of the fair market value that is determined by local assessors to be the total taxable value of land and additions on the property. | Land | Improvement |
|---|---|---|---|---|
| 2024 | $3,519 | $42,840 | $9,860 | $32,980 |
| 2023 | $3,519 | $39,020 | $8,980 | $30,040 |
| 2022 | $3,310 | $35,990 | $8,280 | $27,710 |
| 2021 | $2,681 | $35,290 | $8,120 | $27,170 |
| 2020 | $2,622 | $34,600 | $7,960 | $26,640 |
| 2019 | $2,527 | $33,890 | $7,800 | $26,090 |
| 2018 | $2,462 | $33,360 | $7,680 | $25,680 |
| 2017 | $2,472 | $33,360 | $7,680 | $25,680 |
| 2016 | $2,206 | $32,670 | $7,520 | $25,150 |
| 2015 | $2,214 | $32,090 | $7,390 | $24,700 |
| 2014 | $2,195 | $32,090 | $7,390 | $24,700 |
| 2013 | $2,175 | $32,090 | $7,390 | $24,700 |
Source: Public Records
Map
Nearby Homes
- 1309 Maplepark Dr
- 2808 Carrelton Dr
- 1508 Centennial Dr
- 2612 W Kirby Ave
- 1402 Scottsdale Dr
- 2605 Trafalgar Square
- 1407 Kenwood Rd
- 2501 Sheridan Dr
- 1818 Tahoe Ct
- 3311 Brentwood Dr
- 806 Scottsdale Dr
- 2908 W John St Unit B
- 610 S Duncan Rd Unit A
- 1601 Carolyn Dr
- 1012 Waters Edge Rd
- 2203 W Kirby Ave
- 3510 S Duncan Rd
- 3804 Balmoral Dr
- 1801 Cobblefield Ct
- 1801 Crescent Dr
- 1302 S Duncan Rd
- 2911 Sangamon Dr
- 1304 S Duncan Rd
- 1303 Maplepark Dr
- 1305 Maplepark Dr
- 1306 S Duncan Rd
- 1214 S Duncan Rd
- 2912 Sangamon Dr
- 1307 Maplepark Dr
- 1213 Maplepark Dr
- 1308 S Duncan Rd
- 1212 S Duncan Rd
- 1211 Maplepark Dr
- 2903 Sangamon Dr
- 1310 S Duncan Rd
- 1304 Maplepark Dr
- 2904 Carrelton Dr
- 1311 Maplepark Dr
- 2904 Sangamon Dr
- 1210 S Duncan Rd