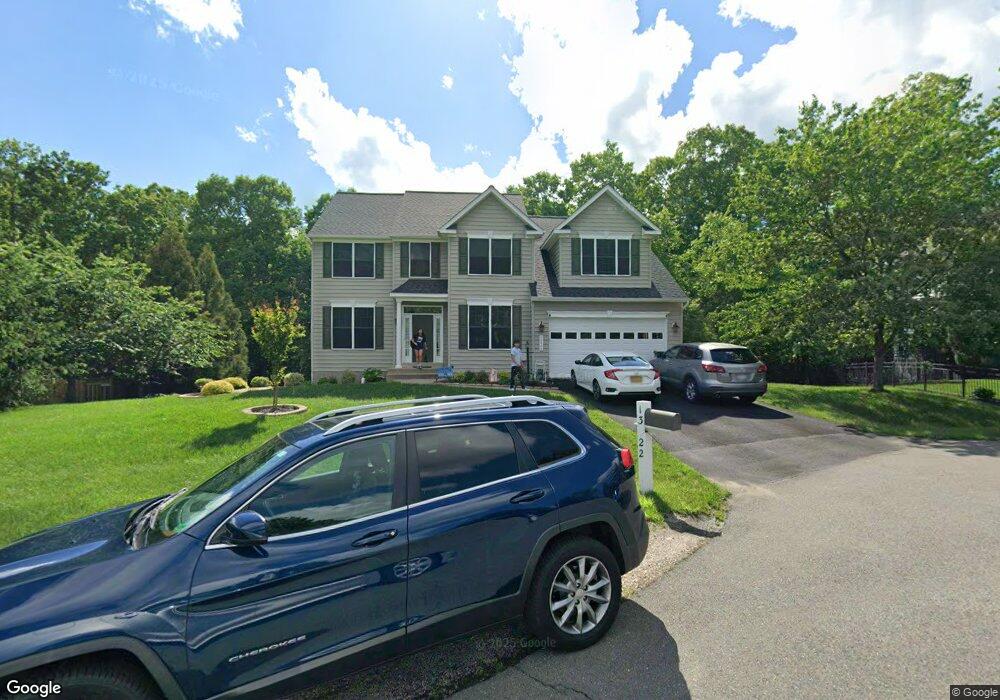
13022 Quay Ct Woodbridge, VA 22193
Queensdale NeighborhoodEstimated Value: $758,891 - $957,000
5
Beds
4
Baths
2,846
Sq Ft
$296/Sq Ft
Est. Value
About This Home
This home is located at 13022 Quay Ct, Woodbridge, VA 22193 and is currently estimated at $841,223, approximately $295 per square foot. 13022 Quay Ct is a home located in Prince William County with nearby schools including Sonnie Penn Elementary School, Charles J. Colgan Senior High School, and Stuart M. Beville Middle School.
Ownership History
Date
Name
Owned For
Owner Type
Purchase Details
Closed on
Feb 16, 2018
Sold by
King Joshua J and King Amynah A
Bought by
King Joshua J
Current Estimated Value
Purchase Details
Closed on
Mar 26, 2009
Sold by
Rechin William M
Bought by
King Joshua J
Home Financials for this Owner
Home Financials are based on the most recent Mortgage that was taken out on this home.
Original Mortgage
$438,223
Outstanding Balance
$279,989
Interest Rate
5.14%
Mortgage Type
VA
Estimated Equity
$561,234
Purchase Details
Closed on
Aug 5, 2002
Sold by
Ridgedale Inc
Bought by
Rechin Susan A
Home Financials for this Owner
Home Financials are based on the most recent Mortgage that was taken out on this home.
Original Mortgage
$262,700
Interest Rate
6.58%
Purchase Details
Closed on
Jan 11, 2002
Sold by
Hylton Enterprises Va Inc
Bought by
Ridgedale Inc
Create a Home Valuation Report for This Property
The Home Valuation Report is an in-depth analysis detailing your home's value as well as a comparison with similar homes in the area
Home Values in the Area
Average Home Value in this Area
Purchase History
| Date | Buyer | Sale Price | Title Company |
|---|---|---|---|
| King Joshua J | -- | None Available | |
| King Joshua J | $429,000 | -- | |
| Rechin Susan A | $328,388 | -- | |
| Ridgedale Inc | $637,500 | -- |
Source: Public Records
Mortgage History
| Date | Status | Borrower | Loan Amount |
|---|---|---|---|
| Open | King Joshua J | $438,223 | |
| Previous Owner | Rechin Susan A | $262,700 |
Source: Public Records
Tax History Compared to Growth
Tax History
| Year | Tax Paid | Tax Assessment Tax Assessment Total Assessment is a certain percentage of the fair market value that is determined by local assessors to be the total taxable value of land and additions on the property. | Land | Improvement |
|---|---|---|---|---|
| 2025 | $6,981 | $795,300 | $236,300 | $559,000 |
| 2024 | $6,981 | $702,000 | $209,000 | $493,000 |
| 2023 | $6,807 | $654,200 | $193,500 | $460,700 |
| 2022 | $7,059 | $627,100 | $184,300 | $442,800 |
| 2021 | $6,651 | $546,300 | $160,300 | $386,000 |
| 2020 | $8,066 | $520,400 | $152,100 | $368,300 |
| 2019 | $8,102 | $522,700 | $152,100 | $370,600 |
| 2018 | $6,082 | $503,700 | $180,000 | $323,700 |
| 2017 | $6,083 | $495,000 | $180,000 | $315,000 |
| 2016 | $5,499 | $451,000 | $163,800 | $287,200 |
| 2015 | $5,210 | $445,600 | $163,800 | $281,800 |
| 2014 | $5,210 | $417,800 | $160,300 | $257,500 |
Source: Public Records
Map
Nearby Homes
- 5518 Victory Loop
- 5467 Quaint Dr
- 5660 Hoadly Rd
- 12849 Hoadly Manor Dr
- 13217 Nickleson Dr
- 5156 Meeting Place
- 5154 Meeting Place
- 5202 Quince Ct
- 5208 Quiet Place
- 13044 Pilgrims Inn Dr
- 13201 Quate Ln
- 13380 Packard Dr
- 13425 Princedale Dr
- 13501 Photo Dr
- 13707 Mapledale Ave
- 12904 Leatherwood Ln
- 6016 Pepco Ct
- 13218 Kurtz Rd
- 5061 Anchorstone Dr Unit 5061
- 13454 Princedale Dr
- 13024 Quay Ct
- 13020 Quay Ct
- 5585 Victory Loop
- 13026 Quay Ct
- 13023 Quay Ct
- 5587 Victory Loop
- 5581 Victory Loop
- 5591 Victory Loop
- 5430 Quinn Ln
- 13028 Quay Ct
- 13021 Quay Ct
- 5583 Victory Loop
- 5595 Victory Loop
- 5428 Quinn Ln
- 5591 Newberry Ct
- 12936 Jessica Ridge Way
- 5599 Victory Loop
- 5593 Newberry Ct
- 5579 Victory Loop
- 5590 Newberry Ct