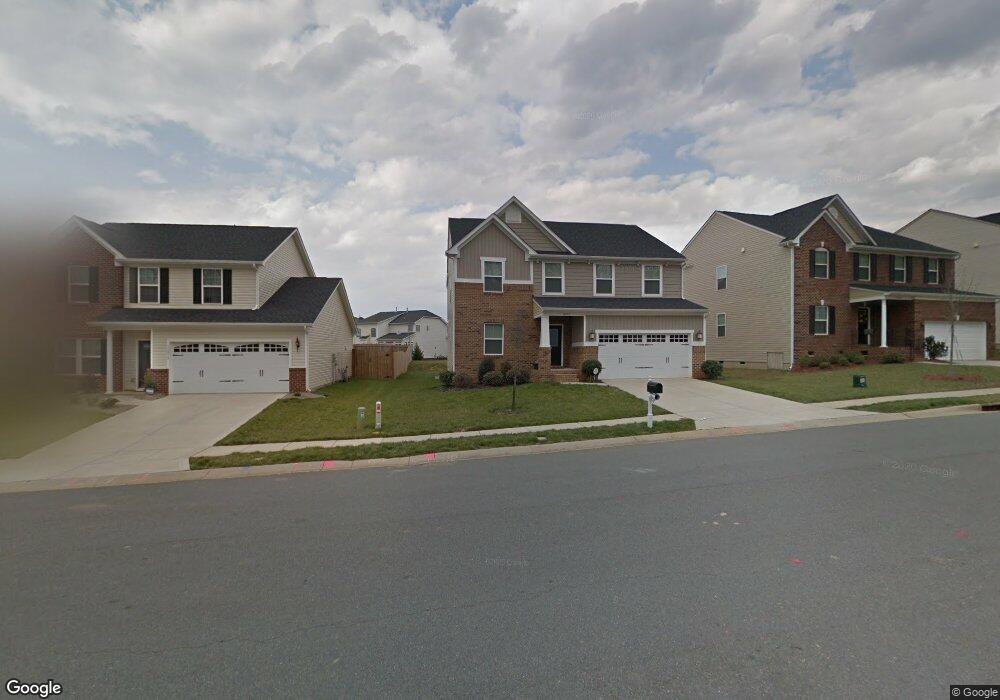
13023 Red Vulcan Ct Charlotte, NC 28213
Back Creek Church Road NeighborhoodEstimated Value: $548,000 - $613,000
4
Beds
4
Baths
3,696
Sq Ft
$159/Sq Ft
Est. Value
About This Home
This home is located at 13023 Red Vulcan Ct, Charlotte, NC 28213 and is currently estimated at $586,676, approximately $158 per square foot. 13023 Red Vulcan Ct is a home located in Mecklenburg County with nearby schools including University Meadows Elementary, James Martin Middle, and Julius L. Chambers High School.
Ownership History
Date
Name
Owned For
Owner Type
Purchase Details
Closed on
Jan 31, 2023
Sold by
Rasheed Douglas B
Bought by
Douglas Bernard Rasheed Living Trust
Current Estimated Value
Purchase Details
Closed on
Jul 26, 2014
Sold by
Ragland Chyrone I
Bought by
Rasheed Douglas B
Home Financials for this Owner
Home Financials are based on the most recent Mortgage that was taken out on this home.
Original Mortgage
$235,653
Interest Rate
4.25%
Mortgage Type
FHA
Purchase Details
Closed on
Sep 27, 2012
Sold by
Nvr Inc
Bought by
Ragland Chyrome I
Home Financials for this Owner
Home Financials are based on the most recent Mortgage that was taken out on this home.
Original Mortgage
$200,000
Interest Rate
3.64%
Mortgage Type
New Conventional
Purchase Details
Closed on
Jun 7, 2012
Sold by
Fc Caldwell Llc
Bought by
Nvr Inc and Ryan Homes
Create a Home Valuation Report for This Property
The Home Valuation Report is an in-depth analysis detailing your home's value as well as a comparison with similar homes in the area
Home Values in the Area
Average Home Value in this Area
Purchase History
| Date | Buyer | Sale Price | Title Company |
|---|---|---|---|
| Douglas Bernard Rasheed Living Trust | -- | -- | |
| Douglas Bernard Rasheed Living Trust | -- | None Listed On Document | |
| Rasheed Douglas B | $240,000 | Fidelity Title | |
| Ragland Chyrome I | $260,500 | None Available | |
| Nvr Inc | $35,000 | None Available |
Source: Public Records
Mortgage History
| Date | Status | Borrower | Loan Amount |
|---|---|---|---|
| Previous Owner | Rasheed Douglas B | $235,653 | |
| Previous Owner | Ragland Chyrome I | $200,000 |
Source: Public Records
Tax History Compared to Growth
Tax History
| Year | Tax Paid | Tax Assessment Tax Assessment Total Assessment is a certain percentage of the fair market value that is determined by local assessors to be the total taxable value of land and additions on the property. | Land | Improvement |
|---|---|---|---|---|
| 2025 | $3,823 | $484,600 | $105,000 | $379,600 |
| 2024 | $3,823 | $484,600 | $105,000 | $379,600 |
| 2023 | $3,823 | $484,600 | $105,000 | $379,600 |
| 2022 | $3,366 | $335,800 | $50,000 | $285,800 |
| 2021 | $3,355 | $335,800 | $50,000 | $285,800 |
| 2020 | $3,348 | $335,800 | $50,000 | $285,800 |
| 2019 | $3,332 | $335,800 | $50,000 | $285,800 |
| 2018 | $3,265 | $243,300 | $33,600 | $209,700 |
| 2017 | $3,212 | $243,300 | $33,600 | $209,700 |
| 2016 | $3,203 | $243,300 | $33,600 | $209,700 |
| 2015 | $3,191 | $243,300 | $33,600 | $209,700 |
| 2014 | $3,187 | $243,300 | $33,600 | $209,700 |
Source: Public Records
Map
Nearby Homes
- 12822 Plumleaf Dr
- 16615 Crimson Sargent Dr
- 4036 Sawmill Trace Dr
- 12705 Caldwell Rd
- 13108 Purple Dawn Dr
- 10048 Greystar Ln
- 20004 Faithwood Ct
- 20005 Faithwood Ct
- 10032 Greystar Ln
- Magnolia Plan at River Ridge Townes
- Chestnut Plan at River Ridge Townes
- 20008 Faithwood Ct
- 10044 Greystar Ln
- 10040 Greystar Ln
- 10036 Greystar Ln
- 11012 N Commons Dr
- 4501 Brookwood Rd
- 12300 Caldwell Rd
- 4328 Woodwind St
- 13812 Connell Green Dr
- 13027 Red Vulcan Ct
- 13019 Red Vulcan Ct
- 13033 Red Vulcan Ct
- 13015 Red Vulcan Ct
- 12902 Cleopatra Dr
- 13026 Red Vulcan Ct
- 13030 Red Vulcan Ct
- 12903 Cleopatra Dr
- 13039 Red Vulcan Ct
- 13011 Red Vulcan Ct
- 13018 Red Vulcan Ct
- 13034 Red Vulcan Ct
- 13045 Red Vulcan Ct
- 13007 Red Vulcan Ct
- 12906 Cleopatra Dr
- 13038 Red Vulcan Ct
- 13105 Red Vulcan Ct
- 13010 Red Vulcan Ct
- 13042 Red Vulcan Ct
- 12907 Cleopatra Dr