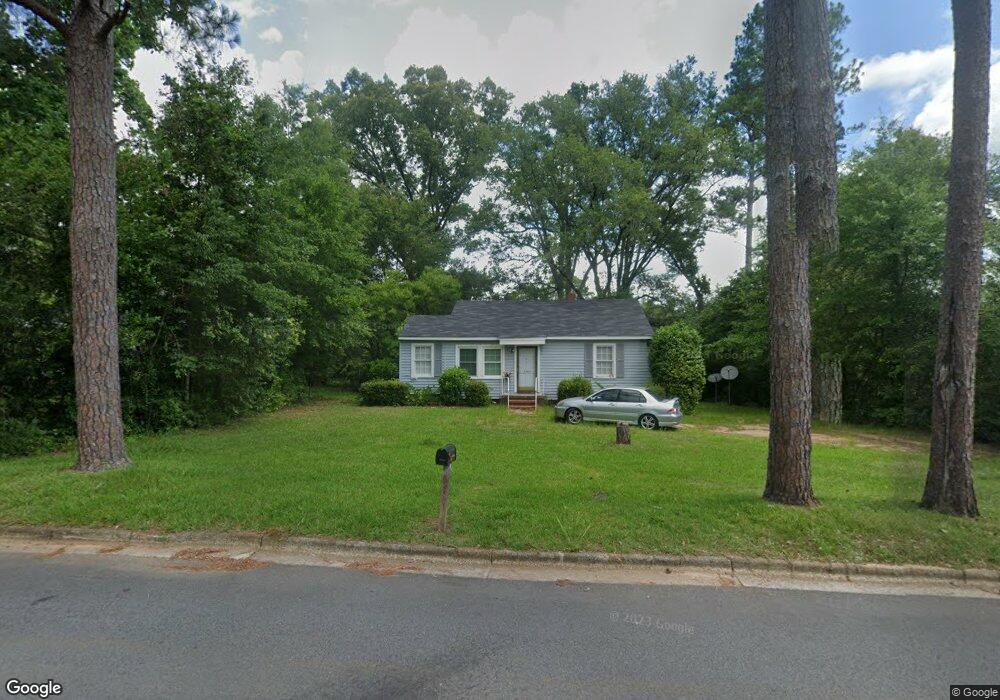
1303 10th Ave Albany, GA 31707
Palmyra Heights NeighborhoodEstimated Value: $68,075 - $80,000
2
Beds
1
Bath
888
Sq Ft
$85/Sq Ft
Est. Value
About This Home
This home is located at 1303 10th Ave, Albany, GA 31707 and is currently estimated at $75,519, approximately $85 per square foot. 1303 10th Ave is a home located in Dougherty County with nearby schools including Sherwood Acres Elementary School, Merry Acres Middle School, and Albany High School.
Ownership History
Date
Name
Owned For
Owner Type
Purchase Details
Closed on
Mar 8, 2022
Sold by
Farkas Sam
Bought by
Big O Properties Llc
Current Estimated Value
Purchase Details
Closed on
Dec 10, 2018
Sold by
Big O Propertries Llc
Bought by
Farkas Sam
Purchase Details
Closed on
Jul 12, 2013
Sold by
Vanlinden Lori Farkas
Bought by
Big O Propertries Llc
Purchase Details
Closed on
Apr 18, 2011
Sold by
Big O Properties Llc
Bought by
Vanlinden Lori Farkas
Purchase Details
Closed on
Jan 3, 2006
Sold by
Rosen Lane
Bought by
Big O Properties Llc
Purchase Details
Closed on
Jun 19, 2002
Sold by
Jefferson Marie B
Bought by
Rosen Lane
Purchase Details
Closed on
Oct 3, 1986
Sold by
Smith Terrell S
Bought by
Jefferson William E
Create a Home Valuation Report for This Property
The Home Valuation Report is an in-depth analysis detailing your home's value as well as a comparison with similar homes in the area
Home Values in the Area
Average Home Value in this Area
Purchase History
| Date | Buyer | Sale Price | Title Company |
|---|---|---|---|
| Big O Properties Llc | -- | -- | |
| Farkas Sam | $30,000 | -- | |
| Big O Propertries Llc | -- | -- | |
| Vanlinden Lori Farkas | -- | -- | |
| Big O Properties Llc | -- | -- | |
| Rosen Lane | $36,500 | -- | |
| Jefferson William E | -- | -- |
Source: Public Records
Tax History Compared to Growth
Tax History
| Year | Tax Paid | Tax Assessment Tax Assessment Total Assessment is a certain percentage of the fair market value that is determined by local assessors to be the total taxable value of land and additions on the property. | Land | Improvement |
|---|---|---|---|---|
| 2024 | $824 | $17,280 | $6,360 | $10,920 |
| 2023 | $805 | $17,280 | $6,360 | $10,920 |
| 2022 | $808 | $17,280 | $6,360 | $10,920 |
| 2021 | $749 | $17,280 | $6,360 | $10,920 |
| 2020 | $751 | $17,280 | $6,360 | $10,920 |
| 2019 | $698 | $16,000 | $6,360 | $9,640 |
| 2018 | $757 | $17,280 | $6,360 | $10,920 |
| 2017 | $705 | $17,280 | $6,360 | $10,920 |
| 2016 | $706 | $17,280 | $6,360 | $10,920 |
| 2015 | $707 | $17,280 | $6,360 | $10,920 |
| 2014 | $762 | $18,840 | $7,920 | $10,920 |
Source: Public Records
Map
Nearby Homes
- 1316 11th Ave
- 1314 9th Ave
- 1307 8th Ave
- 1114 10th Ave
- 1200 13th Ave
- 1113 11th Ave
- 1502 Argonne Dr
- 1112 Whispering Pines Rd
- 1907 Edgewood Ln
- 1306 Gary Ave
- 1302 Gary Ave
- 1000 10th Ave
- 1607 11th Ave
- 1506 7th Ave
- 1907 Homewood Dr
- 1606 Whispering Pines Rd
- 1403 Edgewood Ln
- 1307 5th Ave
- 1206 Acker Dr
- 917 9th Ave