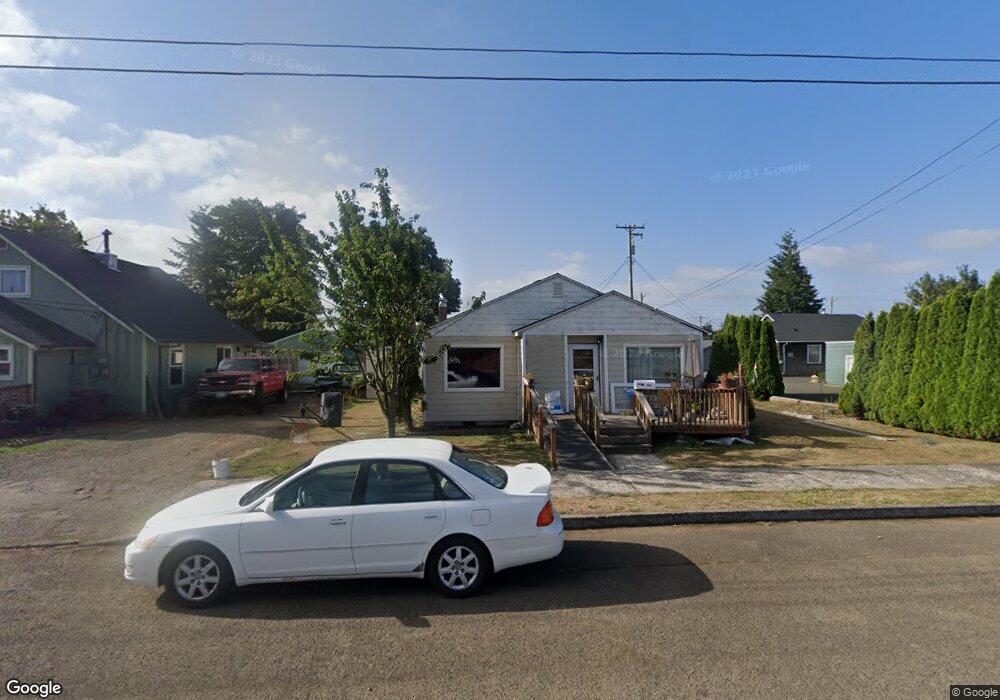
1303 2nd St Tillamook, OR 97141
Estimated Value: $217,000 - $333,000
2
Beds
1
Bath
1,476
Sq Ft
$189/Sq Ft
Est. Value
About This Home
This home is located at 1303 2nd St, Tillamook, OR 97141 and is currently estimated at $279,683, approximately $189 per square foot. 1303 2nd St is a home located in Tillamook County with nearby schools including Tillamook High School, Little Clipper Preschool, and Tillamook Adventist School.
Ownership History
Date
Name
Owned For
Owner Type
Purchase Details
Closed on
Jul 7, 2022
Sold by
Ping Christina E
Bought by
Ping James and Ping Kathy
Current Estimated Value
Home Financials for this Owner
Home Financials are based on the most recent Mortgage that was taken out on this home.
Original Mortgage
$150,000
Outstanding Balance
$142,304
Interest Rate
5.1%
Mortgage Type
New Conventional
Estimated Equity
$137,379
Purchase Details
Closed on
Jun 6, 2007
Sold by
Ping Christina E and Martin Lucille C
Bought by
Ping Christina E
Home Financials for this Owner
Home Financials are based on the most recent Mortgage that was taken out on this home.
Original Mortgage
$75,000
Interest Rate
6.14%
Mortgage Type
New Conventional
Purchase Details
Closed on
Nov 7, 2005
Sold by
Martin James A and Martin Lucille C
Bought by
Ping Christina E
Home Financials for this Owner
Home Financials are based on the most recent Mortgage that was taken out on this home.
Original Mortgage
$42,500
Interest Rate
5%
Mortgage Type
Seller Take Back
Create a Home Valuation Report for This Property
The Home Valuation Report is an in-depth analysis detailing your home's value as well as a comparison with similar homes in the area
Home Values in the Area
Average Home Value in this Area
Purchase History
| Date | Buyer | Sale Price | Title Company |
|---|---|---|---|
| Ping James | $200,000 | Ticor Title | |
| Ping Christina E | -- | Fidelity Natl Title Co Of Or | |
| Ping Christina E | $62,500 | -- | |
| Ping Christina E | $62,500 | First American |
Source: Public Records
Mortgage History
| Date | Status | Borrower | Loan Amount |
|---|---|---|---|
| Open | Ping James | $150,000 | |
| Previous Owner | Ping Christina E | $75,000 | |
| Previous Owner | Ping Christina E | $42,500 |
Source: Public Records
Tax History Compared to Growth
Tax History
| Year | Tax Paid | Tax Assessment Tax Assessment Total Assessment is a certain percentage of the fair market value that is determined by local assessors to be the total taxable value of land and additions on the property. | Land | Improvement |
|---|---|---|---|---|
| 2024 | $1,481 | $125,380 | $47,320 | $78,060 |
| 2023 | $1,467 | $121,730 | $45,940 | $75,790 |
| 2022 | $1,131 | $118,190 | $44,600 | $73,590 |
| 2021 | $1,098 | $114,750 | $43,300 | $71,450 |
| 2020 | $1,068 | $111,410 | $42,040 | $69,370 |
| 2019 | $1,041 | $108,170 | $40,820 | $67,350 |
| 2018 | $1,014 | $105,020 | $39,630 | $65,390 |
| 2017 | $989 | $101,970 | $38,480 | $63,490 |
| 2016 | $952 | $99,000 | $37,360 | $61,640 |
| 2015 | $932 | $96,120 | $36,270 | $59,850 |
| 2014 | $917 | $93,330 | $35,210 | $58,120 |
| 2013 | -- | $90,620 | $34,180 | $56,440 |
Source: Public Records
Map
Nearby Homes