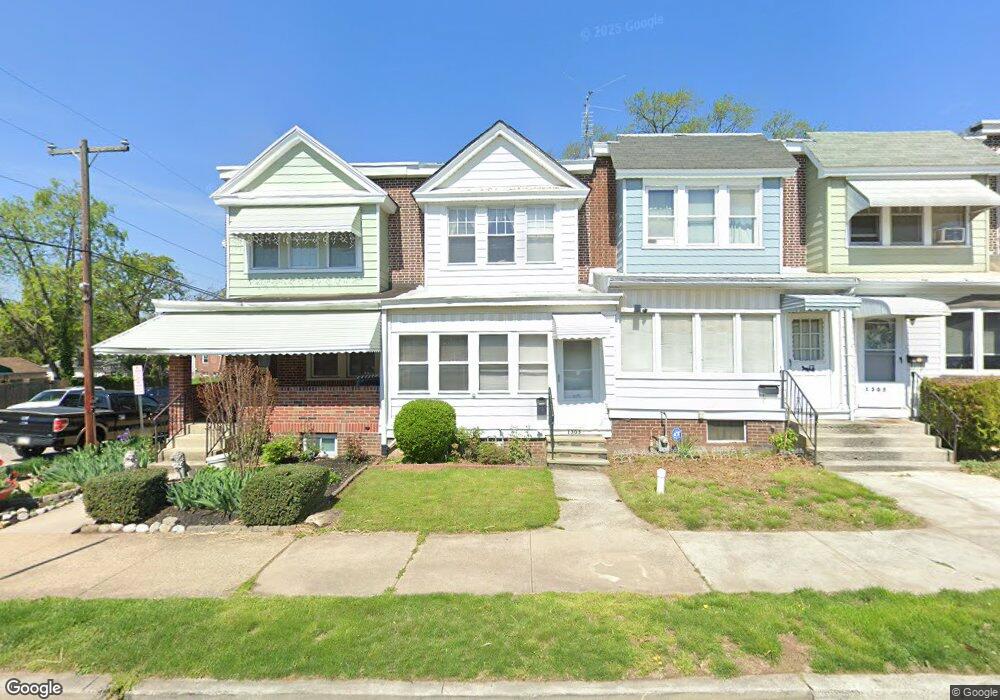
1303 Astor St Norristown, PA 19401
Estimated Value: $165,000 - $224,209
3
Beds
1
Bath
1,015
Sq Ft
$196/Sq Ft
Est. Value
About This Home
This home is located at 1303 Astor St, Norristown, PA 19401 and is currently estimated at $199,052, approximately $196 per square foot. 1303 Astor St is a home located in Montgomery County with nearby schools including Hancock Elementary School, Charles Blockson Middle School, and East Norriton Middle School.
Ownership History
Date
Name
Owned For
Owner Type
Purchase Details
Closed on
Nov 24, 2020
Sold by
Rey Juan C
Bought by
Vasquez Lucia
Current Estimated Value
Purchase Details
Closed on
Mar 3, 2008
Sold by
Marin Agustina and Marin Rodolfo
Bought by
Rey Juan C
Home Financials for this Owner
Home Financials are based on the most recent Mortgage that was taken out on this home.
Original Mortgage
$80,000
Interest Rate
5.57%
Purchase Details
Closed on
Feb 24, 1998
Sold by
Gillan Thomas R and Gillan Kim C
Bought by
Marin Rodolfo and Marin Agustina
Create a Home Valuation Report for This Property
The Home Valuation Report is an in-depth analysis detailing your home's value as well as a comparison with similar homes in the area
Home Values in the Area
Average Home Value in this Area
Purchase History
| Date | Buyer | Sale Price | Title Company |
|---|---|---|---|
| Vasquez Lucia | -- | None Available | |
| Rey Juan C | $100,000 | None Available | |
| Marin Rodolfo | $70,500 | Fidelity National Title Ins |
Source: Public Records
Mortgage History
| Date | Status | Borrower | Loan Amount |
|---|---|---|---|
| Previous Owner | Rey Juan C | $80,000 |
Source: Public Records
Tax History Compared to Growth
Tax History
| Year | Tax Paid | Tax Assessment Tax Assessment Total Assessment is a certain percentage of the fair market value that is determined by local assessors to be the total taxable value of land and additions on the property. | Land | Improvement |
|---|---|---|---|---|
| 2025 | $4,304 | $70,120 | $19,430 | $50,690 |
| 2024 | $4,304 | $70,120 | $19,430 | $50,690 |
| 2023 | $4,265 | $70,120 | $19,430 | $50,690 |
| 2022 | $4,173 | $70,120 | $19,430 | $50,690 |
| 2021 | $4,153 | $70,120 | $19,430 | $50,690 |
| 2020 | $3,962 | $70,120 | $19,430 | $50,690 |
| 2019 | $3,889 | $70,120 | $19,430 | $50,690 |
| 2018 | $2,342 | $70,120 | $19,430 | $50,690 |
| 2017 | $3,572 | $70,120 | $19,430 | $50,690 |
| 2016 | $3,545 | $70,120 | $19,430 | $50,690 |
| 2015 | $3,396 | $70,120 | $19,430 | $50,690 |
| 2014 | $3,396 | $70,120 | $19,430 | $50,690 |
Source: Public Records
Map
Nearby Homes