Estimated Value: $132,204 - $179,000
2
Beds
1
Bath
1,327
Sq Ft
$120/Sq Ft
Est. Value
About This Home
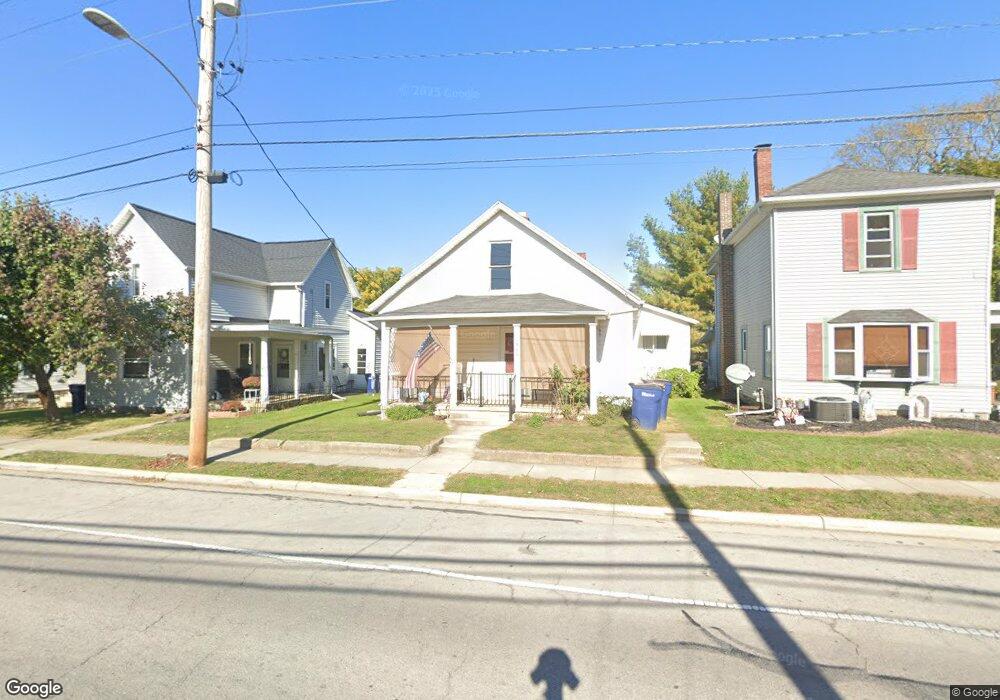
This home is located at 1303 Broadway, Piqua, OH 45356 and is currently estimated at $158,801, approximately $119 per square foot. 1303 Broadway is a home located in Miami County with nearby schools including Piqua Central Intermediate School, Springcreek Primary School, and Piqua Junior High School.
Ownership History
Date
Name
Owned For
Owner Type
Purchase Details
Closed on
Mar 28, 2003
Sold by
Wells Fargo Bank Minnesota Na
Bought by
Douglas Garon M
Current Estimated Value
Purchase Details
Closed on
Jan 14, 2003
Sold by
Smith Lee R
Bought by
Wells Fargo Bank Mn
Purchase Details
Closed on
Jul 10, 2000
Sold by
Home Buyers Equity Services Inc
Bought by
Smith Lee R and Smith Annabelle
Purchase Details
Closed on
Dec 13, 1995
Sold by
Est Lucille E Hafter
Bought by
Wenrick Jeffrey S and Wenrick Rujeana B
Home Financials for this Owner
Home Financials are based on the most recent Mortgage that was taken out on this home.
Original Mortgage
$54,500
Interest Rate
7.45%
Mortgage Type
New Conventional
Purchase Details
Closed on
Jan 1, 1990
Bought by
Hafter Lucille E
Create a Home Valuation Report for This Property
The Home Valuation Report is an in-depth analysis detailing your home's value as well as a comparison with similar homes in the area
Home Values in the Area
Average Home Value in this Area
Purchase History
| Date | Buyer | Sale Price | Title Company |
|---|---|---|---|
| Douglas Garon M | $48,500 | -- | |
| Wells Fargo Bank Mn | $63,000 | -- | |
| Smith Lee R | $74,340 | -- | |
| Wenrick Jeffrey S | $54,500 | -- | |
| Hafter Lucille E | -- | -- |
Source: Public Records
Mortgage History
| Date | Status | Borrower | Loan Amount |
|---|---|---|---|
| Previous Owner | Wenrick Jeffrey S | $54,500 | |
| Closed | Smith Lee R | $0 |
Source: Public Records
Tax History Compared to Growth
Tax History
| Year | Tax Paid | Tax Assessment Tax Assessment Total Assessment is a certain percentage of the fair market value that is determined by local assessors to be the total taxable value of land and additions on the property. | Land | Improvement |
|---|---|---|---|---|
| 2024 | $950 | $25,940 | $8,090 | $17,850 |
| 2023 | $1,091 | $25,940 | $8,090 | $17,850 |
| 2022 | $1,097 | $25,940 | $8,090 | $17,850 |
| 2021 | $828 | $17,820 | $6,230 | $11,590 |
| 2020 | $931 | $17,820 | $6,230 | $11,590 |
| 2019 | $946 | $17,820 | $6,230 | $11,590 |
| 2018 | $1,008 | $17,960 | $6,230 | $11,730 |
| 2017 | $1,021 | $17,960 | $6,230 | $11,730 |
| 2016 | $1,021 | $17,960 | $6,230 | $11,730 |
| 2015 | $1,027 | $17,260 | $5,990 | $11,270 |
| 2014 | $1,027 | $17,260 | $5,990 | $11,270 |
| 2013 | $1,039 | $17,260 | $5,990 | $11,270 |
Source: Public Records
Map
Nearby Homes