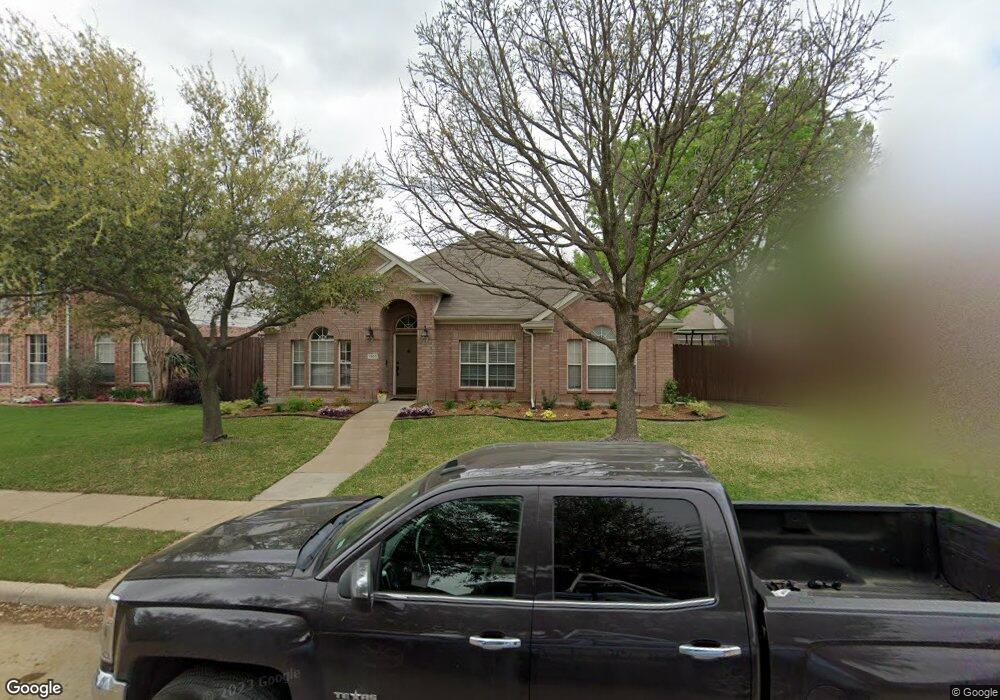
1303 Cassandra Ln Allen, TX 75002
South East Allen NeighborhoodEstimated Value: $430,000 - $450,000
3
Beds
2
Baths
2,065
Sq Ft
$214/Sq Ft
Est. Value
About This Home
This home is located at 1303 Cassandra Ln, Allen, TX 75002 and is currently estimated at $441,372, approximately $213 per square foot. 1303 Cassandra Ln is a home located in Collin County with nearby schools including Bolin Elementary School, W.E. Pete Ford Middle School, and Lowery Freshman Center.
Ownership History
Date
Name
Owned For
Owner Type
Purchase Details
Closed on
Apr 14, 2006
Sold by
Canova Giuatano and Canova Kim L
Bought by
Curley Kevin Michael and Curley Abigail Cooper
Current Estimated Value
Home Financials for this Owner
Home Financials are based on the most recent Mortgage that was taken out on this home.
Original Mortgage
$131,200
Outstanding Balance
$75,222
Interest Rate
6.32%
Estimated Equity
$366,150
Purchase Details
Closed on
Mar 5, 1999
Sold by
Legacy/Monterey Homes Lp
Bought by
Canova Giuatano and Canova Kim L
Home Financials for this Owner
Home Financials are based on the most recent Mortgage that was taken out on this home.
Original Mortgage
$131,900
Interest Rate
6.8%
Purchase Details
Closed on
Nov 3, 1998
Sold by
Acacia Texas Lp
Bought by
Legacy/Monterey Homes Lp
Home Financials for this Owner
Home Financials are based on the most recent Mortgage that was taken out on this home.
Original Mortgage
$87,926
Interest Rate
6.57%
Create a Home Valuation Report for This Property
The Home Valuation Report is an in-depth analysis detailing your home's value as well as a comparison with similar homes in the area
Home Values in the Area
Average Home Value in this Area
Purchase History
| Date | Buyer | Sale Price | Title Company |
|---|---|---|---|
| Curley Kevin Michael | -- | Hftc | |
| Canova Giuatano | -- | -- | |
| Legacy/Monterey Homes Lp | -- | -- |
Source: Public Records
Mortgage History
| Date | Status | Borrower | Loan Amount |
|---|---|---|---|
| Open | Curley Kevin Michael | $131,200 | |
| Previous Owner | Canova Giuatano | $131,900 | |
| Previous Owner | Legacy/Monterey Homes Lp | $87,926 |
Source: Public Records
Tax History Compared to Growth
Tax History
| Year | Tax Paid | Tax Assessment Tax Assessment Total Assessment is a certain percentage of the fair market value that is determined by local assessors to be the total taxable value of land and additions on the property. | Land | Improvement |
|---|---|---|---|---|
| 2025 | $5,349 | $414,248 | $135,000 | $314,821 |
| 2024 | $5,349 | $376,589 | $135,000 | $325,557 |
| 2023 | $5,349 | $342,354 | $120,000 | $302,865 |
| 2022 | $6,179 | $311,231 | $98,000 | $278,087 |
| 2021 | $6,016 | $282,937 | $70,000 | $212,937 |
| 2020 | $5,805 | $263,381 | $70,000 | $193,381 |
| 2019 | $6,200 | $268,407 | $70,000 | $198,407 |
| 2018 | $6,328 | $269,033 | $70,000 | $205,940 |
| 2017 | $5,753 | $251,148 | $60,000 | $191,148 |
| 2016 | $5,335 | $245,921 | $55,000 | $190,921 |
| 2015 | $4,320 | $203,895 | $50,000 | $153,895 |
Source: Public Records
Map
Nearby Homes
- 4705 Fulbrook Dr
- 803 Carolyn Ln
- Remington 2FS (w/Media) Plan at Parker Ranch
- Covington FS Plan at Parker Ranch
- Worthington FS Plan at Parker Ranch
- 5005 Whisper Dr
- 807 Big Bend Dr
- 810 Linda Ct
- 4901 Keswick Dr
- 810 Patricia Dr
- 1436 Christine Dr
- 730 Seminole Trail
- 5001 Keswick Dr
- 5302 Berwick Ln
- 646 Huntington Ln
- 1110 Grimsworth Ln
- 623 Stretford Ln
- 706 Seminole Trail
- 1206 Heather Brook Dr
- 1513 Hidden Cove Ct
- 1305 Cassandra Ln
- 1301 Cassandra Ln
- 1307 Cassandra Ln
- 1302 Hillcrest Dr
- 1304 Hillcrest Dr
- 1300 Hillcrest Dr
- 1306 Hillcrest Dr
- 1309 Cassandra Ln
- 1304 Cassandra Ln
- 1302 Cassandra Ln
- 1306 Cassandra Ln
- 904 Ashley Ln
- 902 Ashley Ln
- 906 Ashley Ln
- 1308 Hillcrest Dr
- 1308 Cassandra Ln
- 1300 Cassandra Ln
- 900 Ashley Ln
- 1311 Cassandra Ln
- 908 Ashley Ln